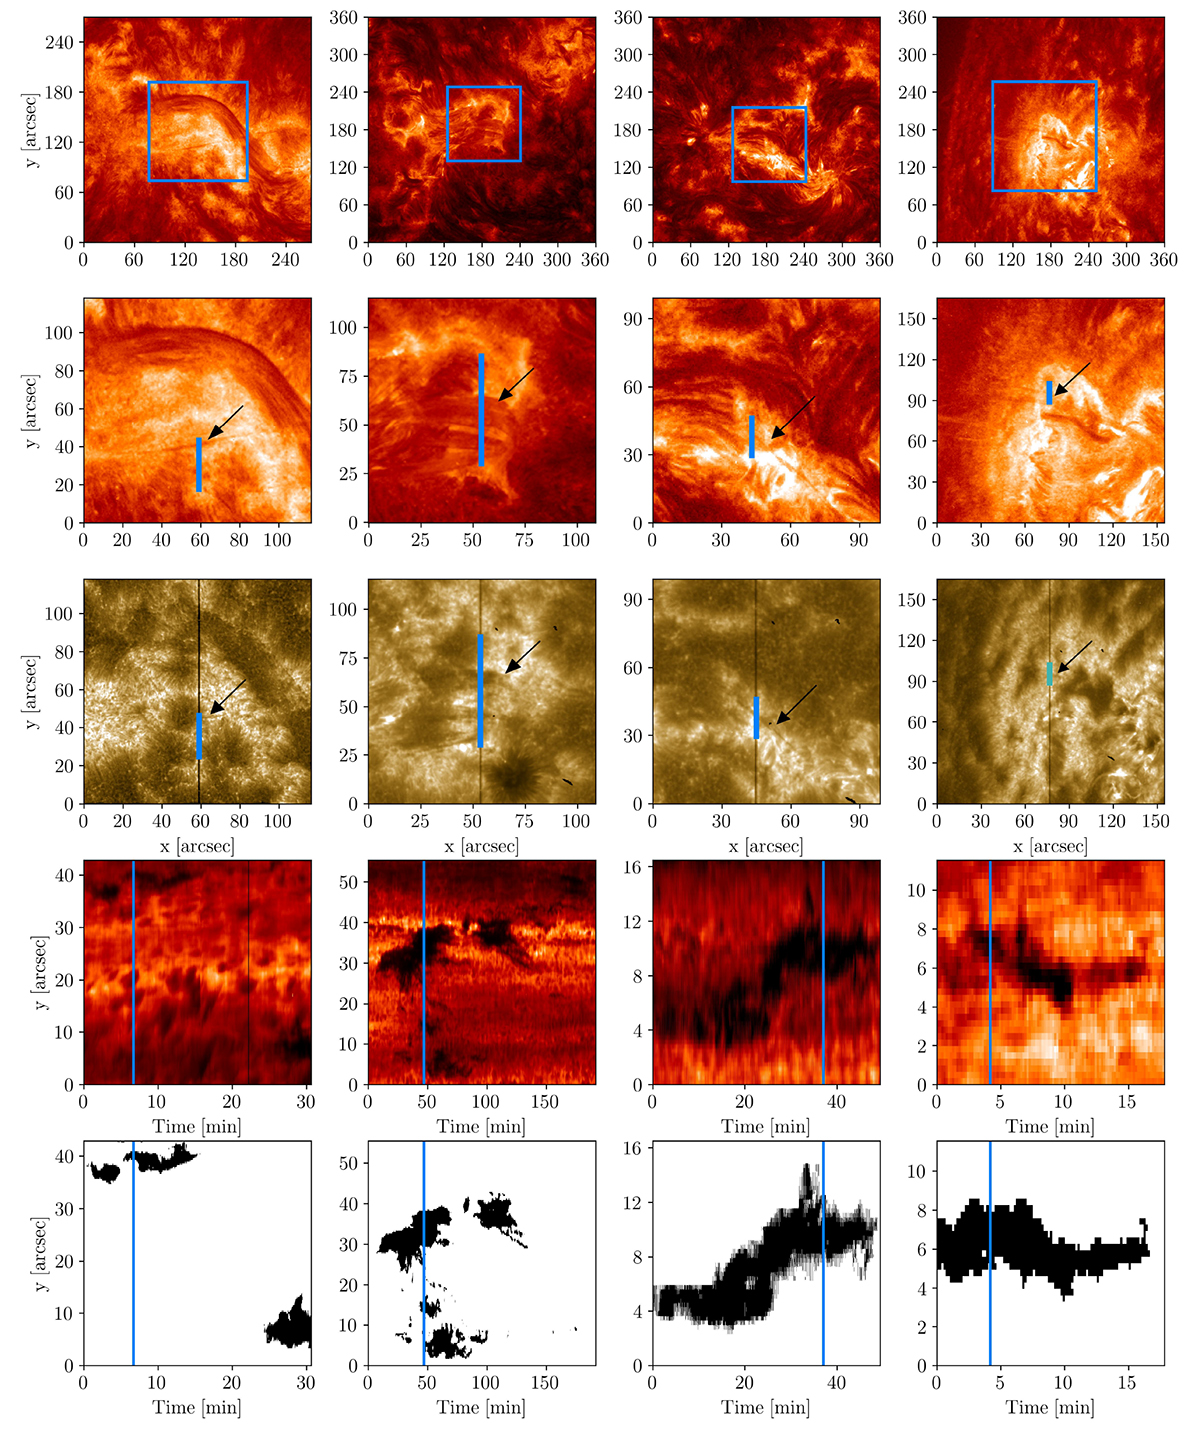
Fig. 1.
Download original image
Observations used in this study. Each column corresponds to one of four of the observations listed in Table 1, namely: observations 1, 7, 8, and 9. The first row displays the field of view of the IRIS slitjaw imager as a coloured rectangle within a co-aligned image in the 30.4 nm passband obtainedw with SDO/AIA. The second row panels display a zoomed view into the field of view inside the rectangles of the first row panels. The corresponding slitjaw images in the 279.6 nm passband are displayed in the third row panels. The thick vertical lines in each panel of the second and third rows outline the spatial portion of the slit used in the fourth row panels. Arrows indicate the location of coronal rain as it crosses the slit. The fourth row panels display the intensity in the core of the Mg II h line as a function of time. The vertical coloured lines in each panel of the fourth row provides the time instant used for the images in the top three corresponding panels. Finally, the last row shows a mask of the fourth row panels for each observation, with the pixels used for the inversions in each case shown in black. The areas coloured white were not used in the inversions. Two accompanying movies display the coronal rain formation and its crossing of the slit position for observations 7 and 8. The two movies have been trimmed to show the time when coronal rain is present.
Current usage metrics show cumulative count of Article Views (full-text article views including HTML views, PDF and ePub downloads, according to the available data) and Abstracts Views on Vision4Press platform.
Data correspond to usage on the plateform after 2015. The current usage metrics is available 48-96 hours after online publication and is updated daily on week days.
Initial download of the metrics may take a while.