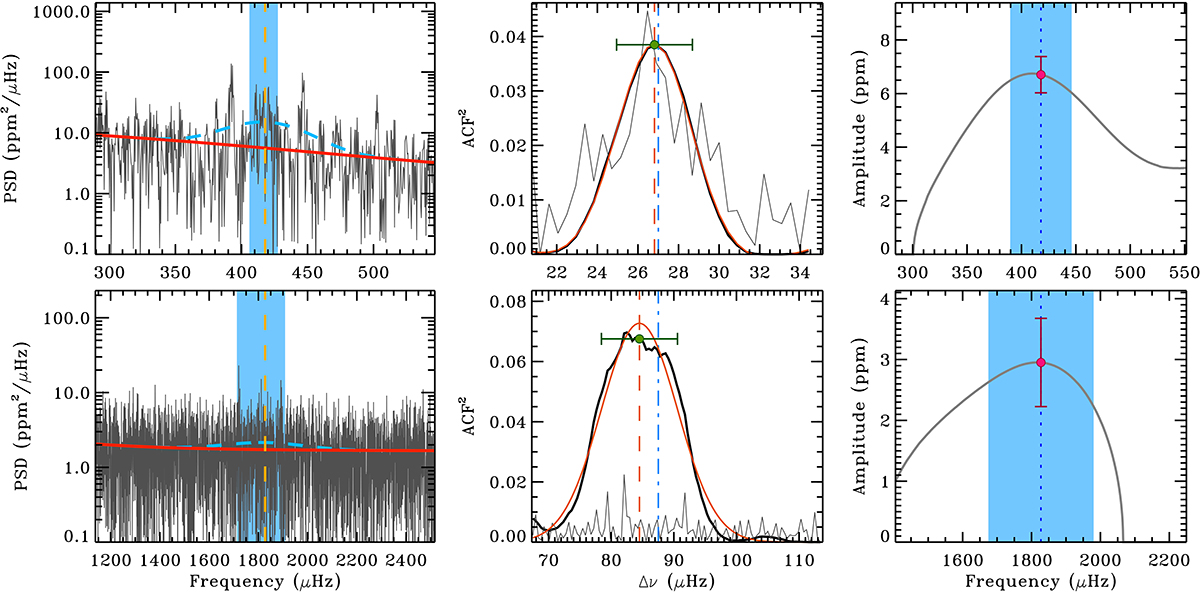
Fig. 3.
Download original image
Example of measuring Δν and Amax for the stars TIC 375621179 (HD 188512, top) and TIC 408842743 (HD 187691, bottom). Left panels: Stellar PSD (in gray). The background fit without the Gaussian envelope is overlaid (in red). The fitted Gaussian envelope above the background is marked with a dashed blue line. The vertical blue band corresponds to a 3σ Bayesian credible region around νmax (vertical dashed orange line) as obtained from DIAMONDS. Middle panels: ACF2 function to estimate Δν as computed on the original PSD (light gray curve) and on the PSD smoothed by Δν/10 (thick black curve). The dot-dashed blue line marks the position of Δν from the scaling relation. The selected Gaussian fit is shown as the orange curve, and its centroid is indicated by the vertical dashed orange line. The final estimate of Δν is represented by the green bullet, and its 1σ uncertainty is overlaid. Right panels: Smoothed amplitude spectrum (in gray). The estimate of Amax and its 1σ uncertainty are marked by the magenta bullet at the position of νmax (vertical dotted blue line). The shaded blue region depicts the range over which the uncertainty on Amax is computed, νmax ± σenv.
Current usage metrics show cumulative count of Article Views (full-text article views including HTML views, PDF and ePub downloads, according to the available data) and Abstracts Views on Vision4Press platform.
Data correspond to usage on the plateform after 2015. The current usage metrics is available 48-96 hours after online publication and is updated daily on week days.
Initial download of the metrics may take a while.