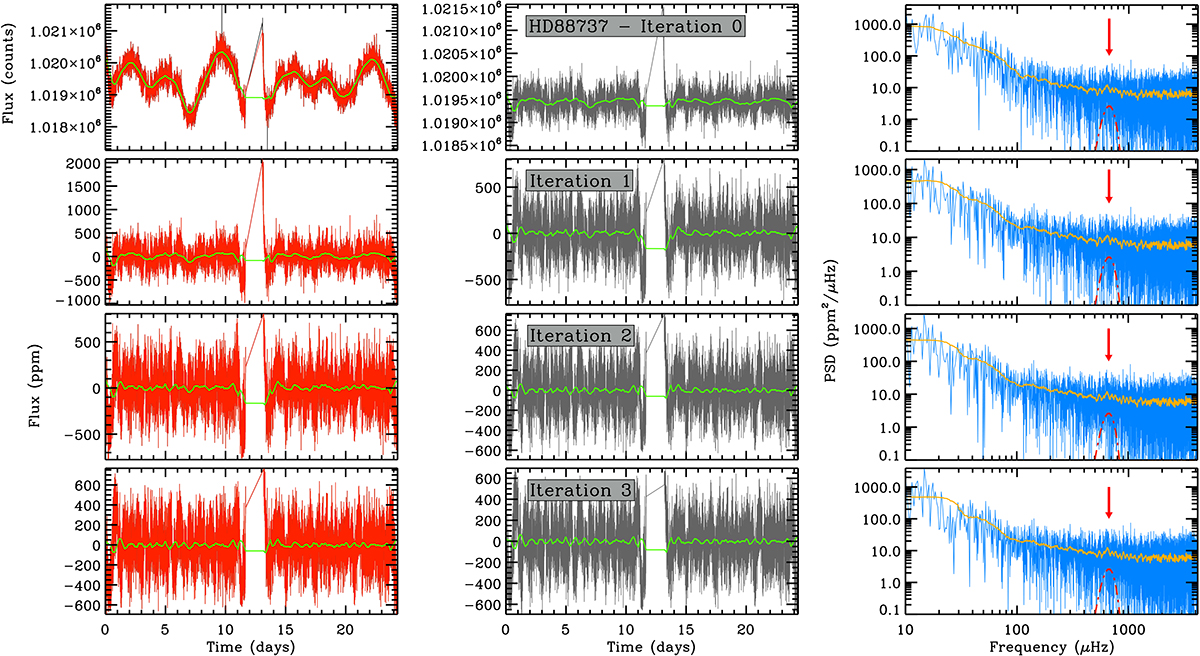
Fig. 1.
Download original image
Data preparation process for the light curve of TIC 95340781 (HD 88737). Each row represents a different iteration (four in total), as outlined in Sect. 2. The first column shows the light curve before the filtering is applied (in orange), the second column shows the (residual) light curve after the filtering is applied (in gray), and the third column shows the PSD of the residual light curve (in blue). The solid green line shows the smoothing of the light curve at each step, and the yellow line in the third column represents the smoothing of the PSD (i.e., an approximation of the background level; see Sect. 3.1) by a default window of 30 bins. The red arrow marks the position of a power excess typical of solar-like oscillations, here represented by the νmax parameter and the modeled Gaussian function (dot-dashed red line) obtained from the background fit (see Sect. 3). The light-curve units change from counts during the first iteration to ppm for the remainder of the iterations.
Current usage metrics show cumulative count of Article Views (full-text article views including HTML views, PDF and ePub downloads, according to the available data) and Abstracts Views on Vision4Press platform.
Data correspond to usage on the plateform after 2015. The current usage metrics is available 48-96 hours after online publication and is updated daily on week days.
Initial download of the metrics may take a while.