Fig. 1
Download original image
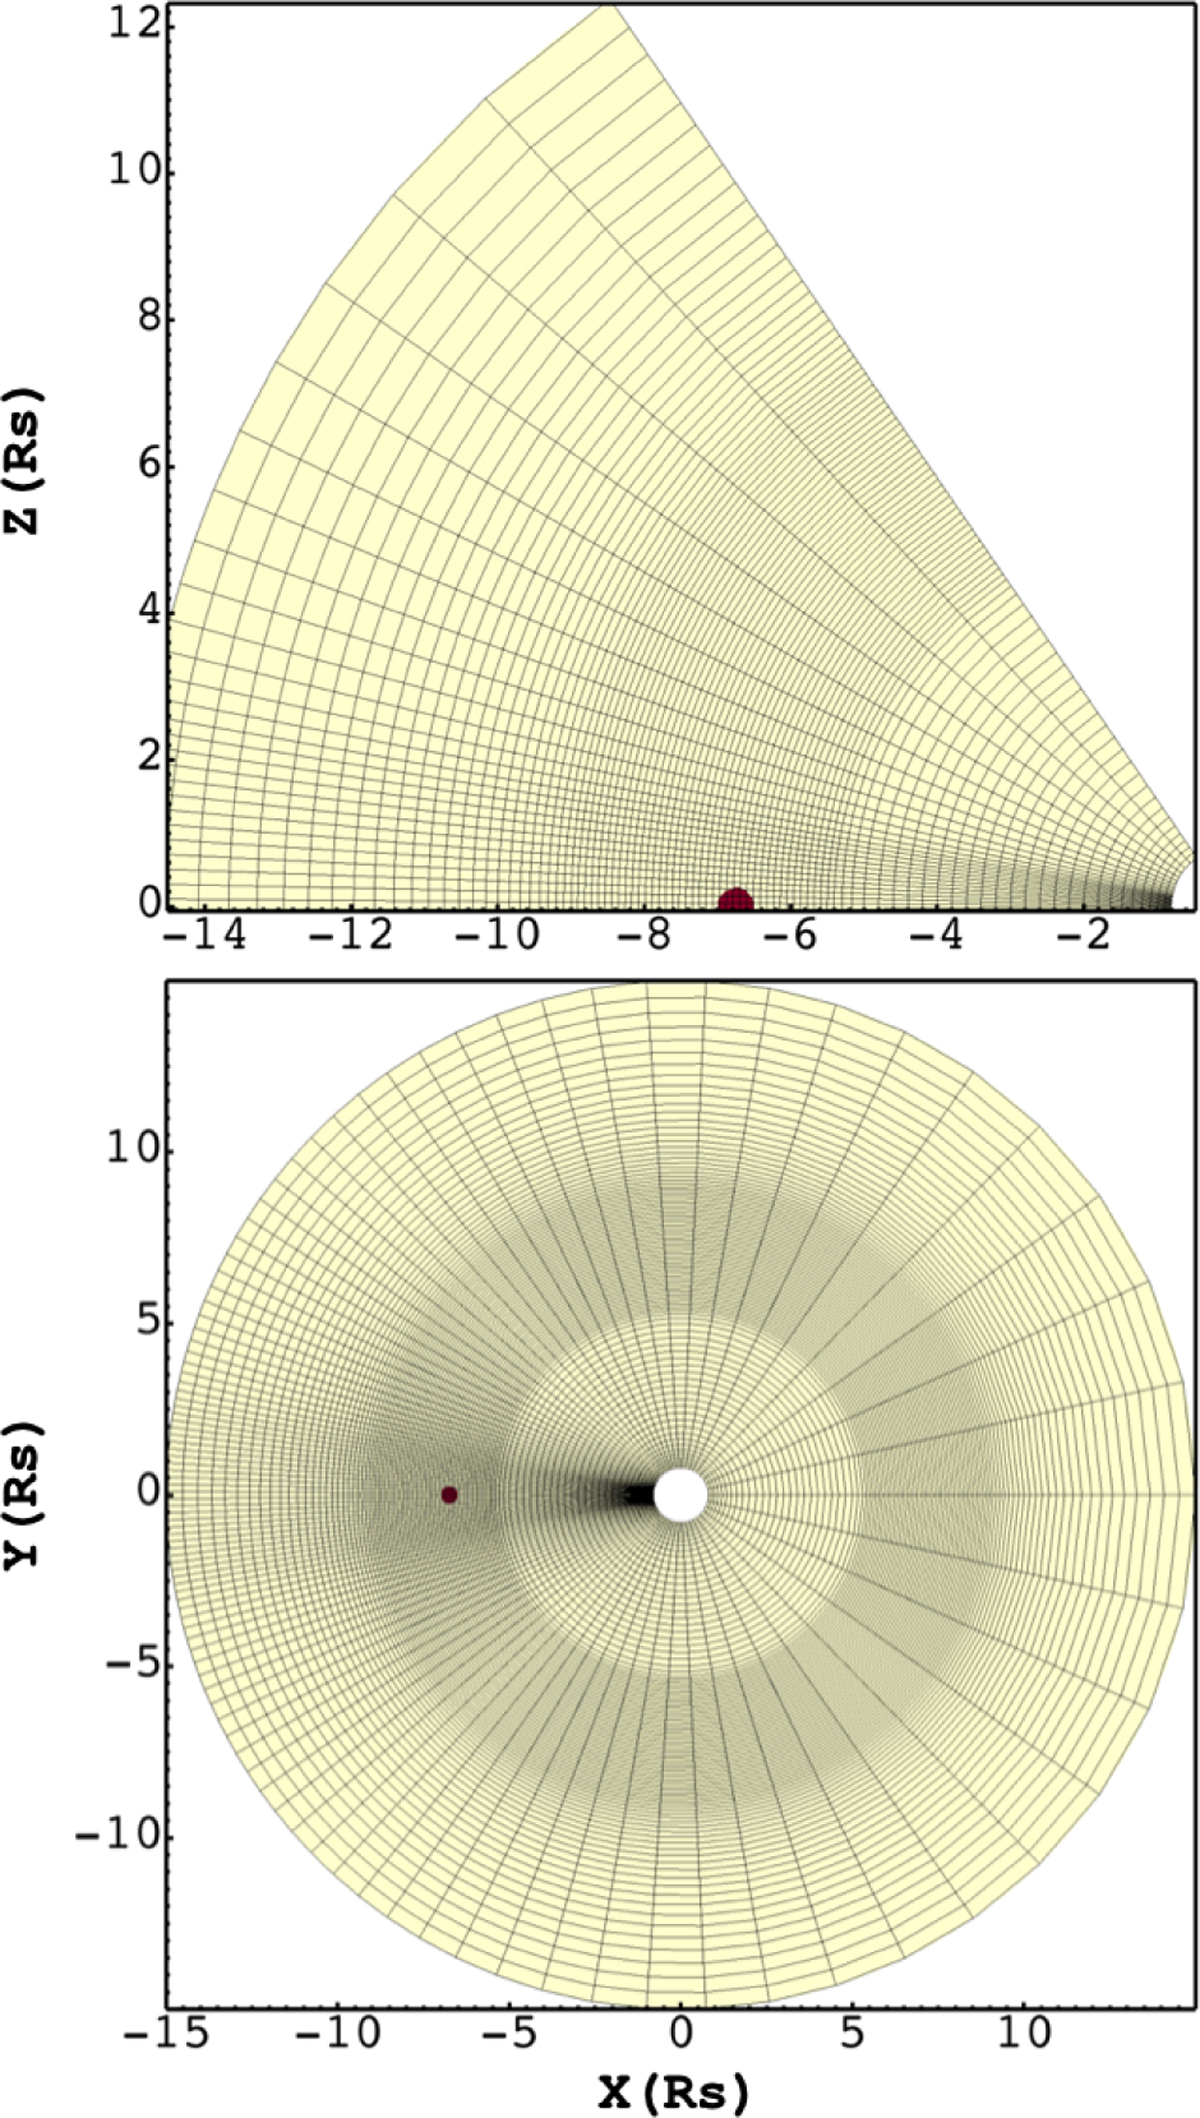
Structure of the numerical grid used in the model. Top panel: slice of one quadrant of the xz plane. To enhance clarity and due to symmetry, only half of the domain is shown. Bottom panel: slice in the xy (equatorial) plane. The dark red dot represents the planet. To enhance clarity, the black grid is four times coarser than the adopted resolution (i.e., each box contains 4 × 4 grid points).
Current usage metrics show cumulative count of Article Views (full-text article views including HTML views, PDF and ePub downloads, according to the available data) and Abstracts Views on Vision4Press platform.
Data correspond to usage on the plateform after 2015. The current usage metrics is available 48-96 hours after online publication and is updated daily on week days.
Initial download of the metrics may take a while.