Open Access
Fig. 7.
Download original image
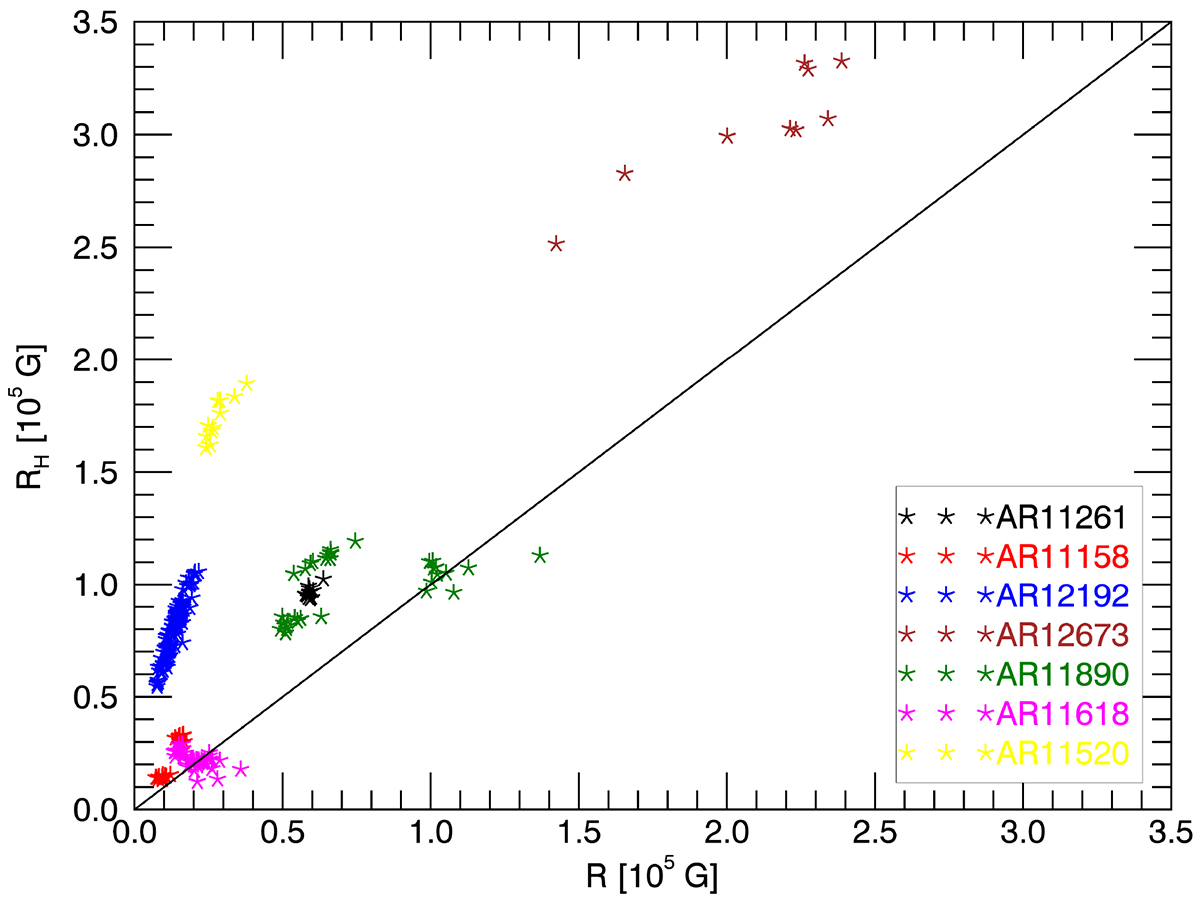
Scatter plot of the values of RH for the case of ![]() vs. the respective R values, for the 22 examined flares, colour-coded according to the specific AR (see inset for legend). The two sets exhibit a linear correlation coefficient of 0.79. The solid line corresponds to the relation R = RH.
vs. the respective R values, for the 22 examined flares, colour-coded according to the specific AR (see inset for legend). The two sets exhibit a linear correlation coefficient of 0.79. The solid line corresponds to the relation R = RH.
Current usage metrics show cumulative count of Article Views (full-text article views including HTML views, PDF and ePub downloads, according to the available data) and Abstracts Views on Vision4Press platform.
Data correspond to usage on the plateform after 2015. The current usage metrics is available 48-96 hours after online publication and is updated daily on week days.
Initial download of the metrics may take a while.