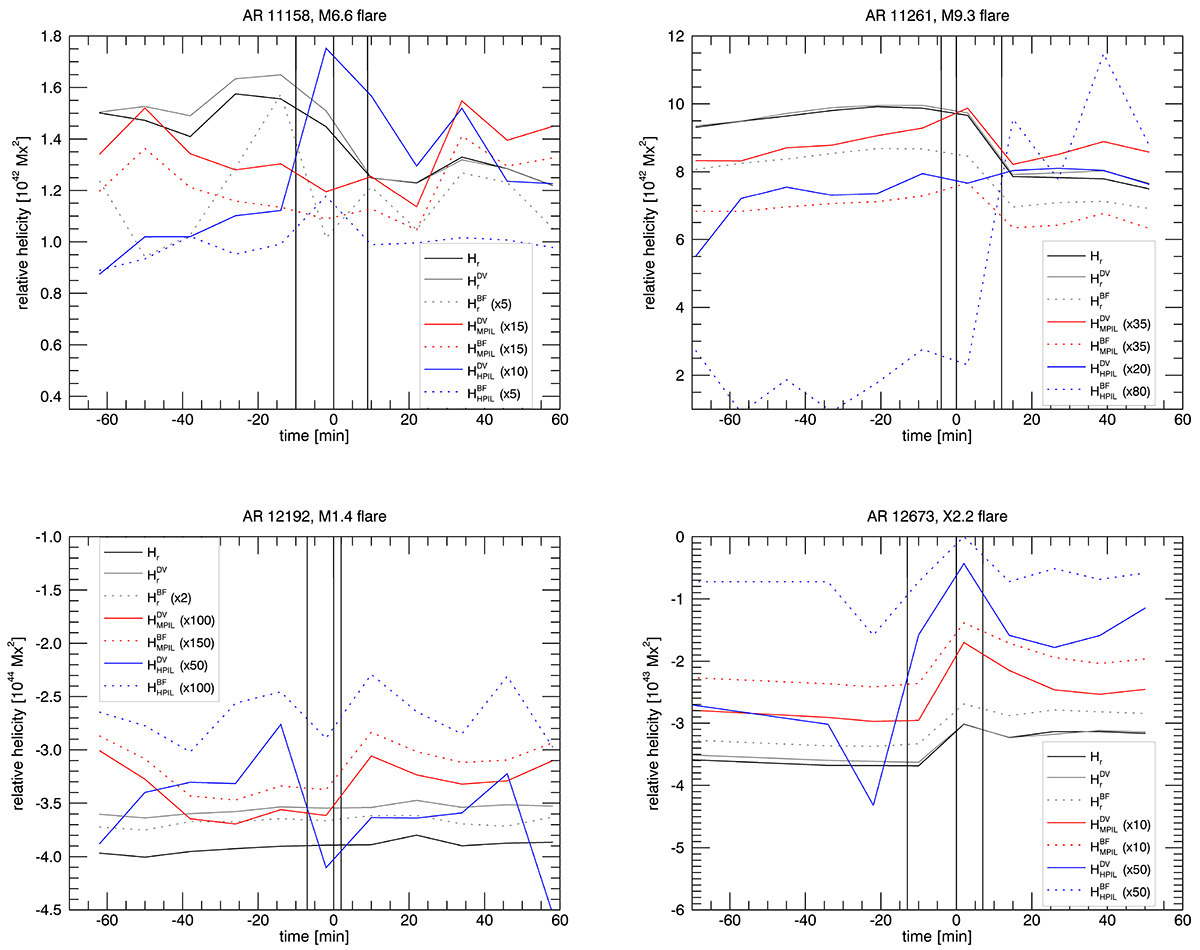
Fig. 4.
Download original image
Evolution of various relative helicities around four of the examined flares. Two are eruptive, ARs 11158 and 11261 (top row), and two confined, ARs 12192 and 12673 (bottom row). Shown are the relative helicities as computed from the volume method (black solid line), the RFLH in the DV gauge (grey solid line), and the RFLH in the BF gauge (grey dotted line). Also shown are the relative helicities at the MPIL (red lines: solid DV; dotted BF), and at the two HPILs (blue lines: solid DV; dotted BF). The vertical black lines denote the start, peak, and end times of the flares (from left to right), after the curves have been shifted so that the peak time corresponds to the zero time. The multiplication factors shown in the legends are used for better visualization of the respective curves.
Current usage metrics show cumulative count of Article Views (full-text article views including HTML views, PDF and ePub downloads, according to the available data) and Abstracts Views on Vision4Press platform.
Data correspond to usage on the plateform after 2015. The current usage metrics is available 48-96 hours after online publication and is updated daily on week days.
Initial download of the metrics may take a while.