Fig. 1.
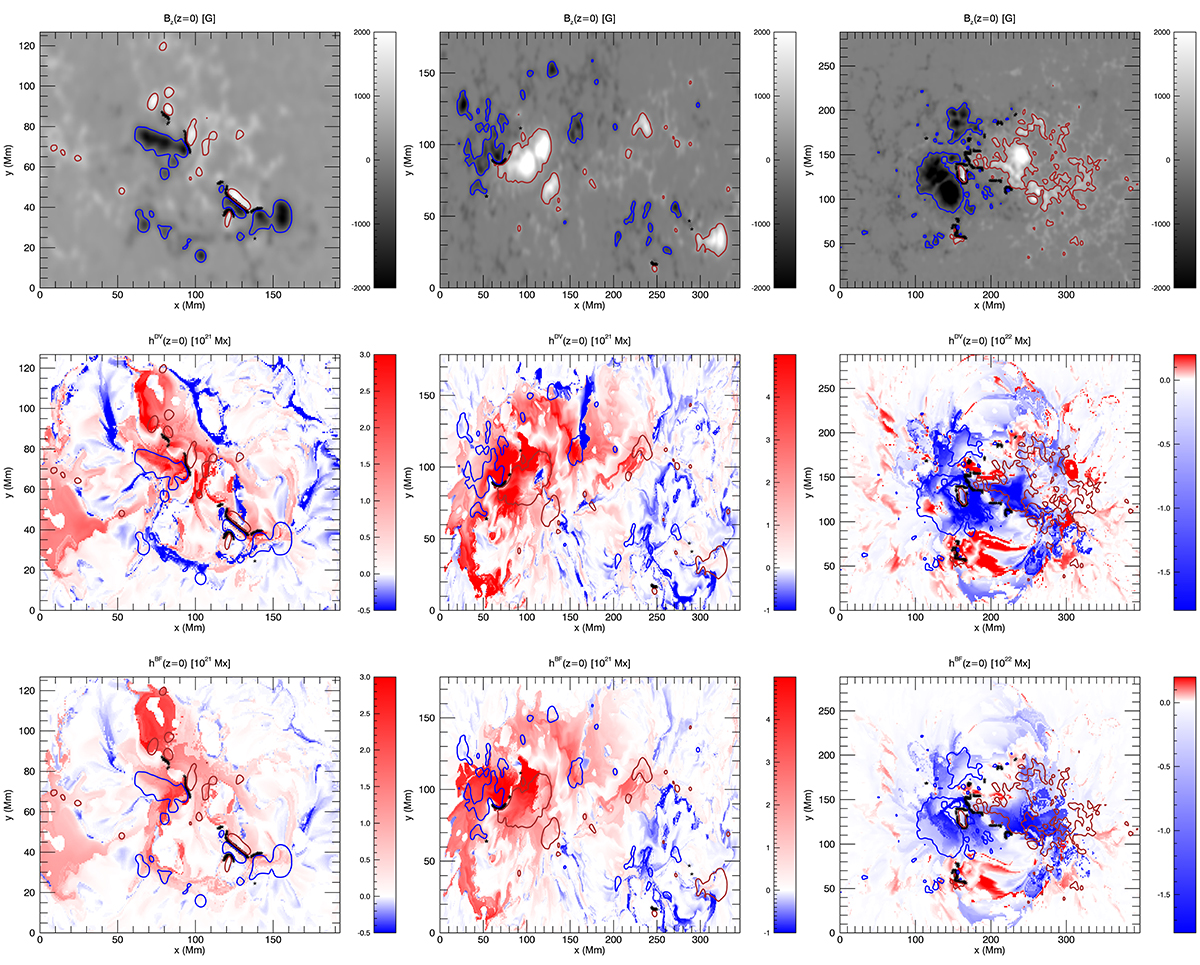
Download original image
Selected snapshots showing the photospheric distribution of the normal component of the magnetic field Bz (top row), and of RFLH in the DV (middle row) and in the BF gauge (bottom row), right before the strongest flares of three ARs. For AR 11261 this was on 4 August 2011, 03:36 UT (left column), for AR 11520 on 12 July 2012, 15:36 UT (middle column), and for AR 12192 on 24 October 2014, 21:11 UT (right column). The red (blue) contours correspond to values of Bz = +500 G (Bz = −500 G), while the locations of the simple magnetic polarity inversion lines are shown with black stars. From left to right, the pairs of RFLH images exhibit pixel-to-pixel linear correlation coefficients of 0.78, 0.84, and 0.75.
Current usage metrics show cumulative count of Article Views (full-text article views including HTML views, PDF and ePub downloads, according to the available data) and Abstracts Views on Vision4Press platform.
Data correspond to usage on the plateform after 2015. The current usage metrics is available 48-96 hours after online publication and is updated daily on week days.
Initial download of the metrics may take a while.