Fig. 4
Download original image
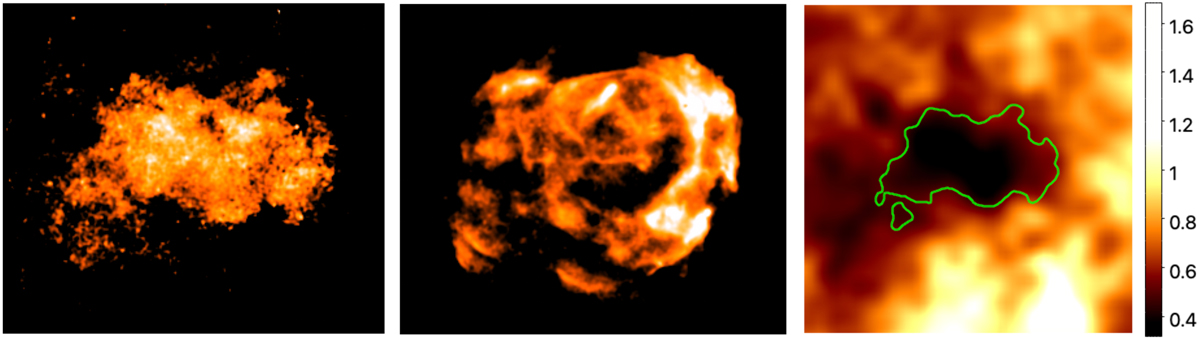
Thermal candidate distribution in RX J1713.7-3946. On the left, we show the component retrieved by GMCA that we identify as potential thermal emission. In the middle, we show the component retrieved by GMCA that we identify as synchrotron emission. The scales are logarithmic. The compact object in the center has been masked. On the right, we show the column density map derived from optical extinction (in units of 1022 cm−2), over which we superimpose the contour of our thermal candidate.
Current usage metrics show cumulative count of Article Views (full-text article views including HTML views, PDF and ePub downloads, according to the available data) and Abstracts Views on Vision4Press platform.
Data correspond to usage on the plateform after 2015. The current usage metrics is available 48-96 hours after online publication and is updated daily on week days.
Initial download of the metrics may take a while.