Fig. 3
Download original image
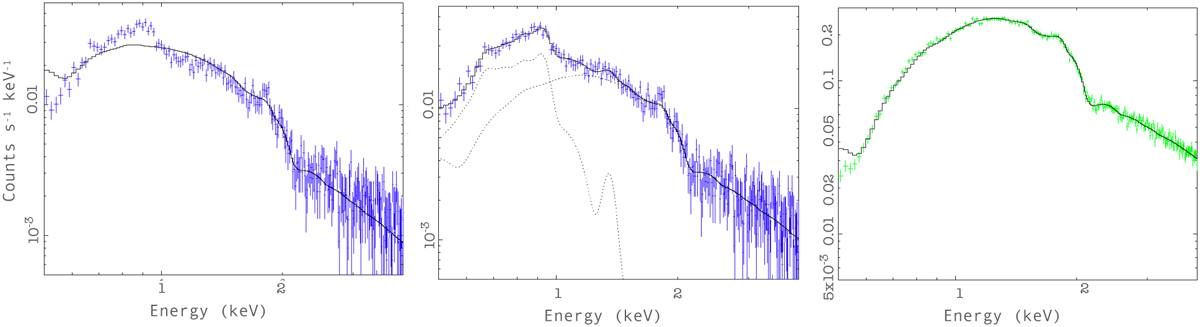
Background-subtracted spectra extracted from the thermal and synchrotron-dominated regions from the right panel of Fig. 2. On the left, we show the spectrum extracted from the thermal region fitted with a phabs(powerlaw) model in Xspec. In the middle, we show the same thermal spectrum fitted with a phabs(powerlaw+vnei) model. Best-fit parameters of this model are shown in Table 2. On the right, we show the spectrum extracted from the synchrotron-dominated region fitted with a simple phabs(powerlaw) model.
Current usage metrics show cumulative count of Article Views (full-text article views including HTML views, PDF and ePub downloads, according to the available data) and Abstracts Views on Vision4Press platform.
Data correspond to usage on the plateform after 2015. The current usage metrics is available 48-96 hours after online publication and is updated daily on week days.
Initial download of the metrics may take a while.