Fig. 2
Download original image
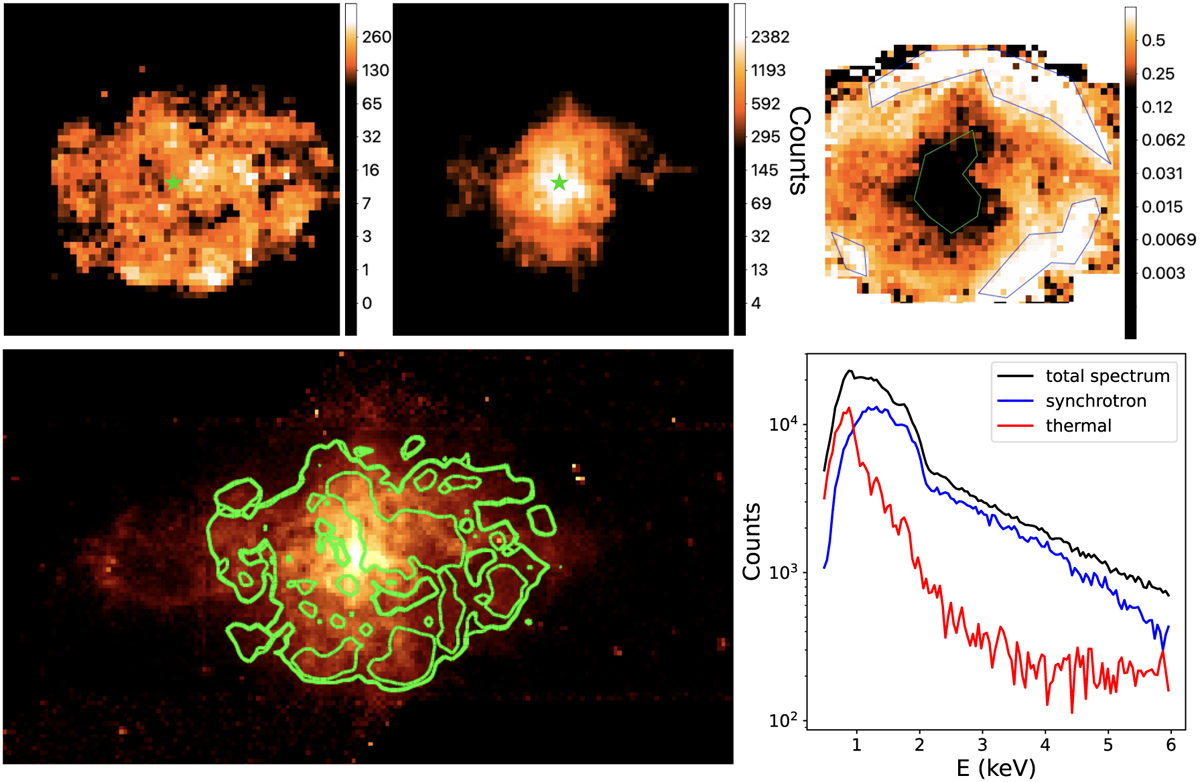
Thermal emission distribution in 3C58. In the top left panel, we show the component retrieved by pGMCA that we identify as thermal emission. In the middle, we show the main component retrieved by pGMCA that we identify as synchrotron emission. The green stars highlight the pulsar position. On the right, we present a ratio map thermal/(thermal+synchrotron). The regions we used to extract a spectrum are overlaid in blue (thermal) and green (synchrotron). In the bottom left, we show a broadband flux image of 3C58 obtained using the merge_obs routine from CIAO, which is superimposed with the contours from the thermal emission. For all the images, the scales are logarithmic. In the bottom right panel, we show spectra retrieved by pGMCA associated to the thermal and synchrotron emissions.
Current usage metrics show cumulative count of Article Views (full-text article views including HTML views, PDF and ePub downloads, according to the available data) and Abstracts Views on Vision4Press platform.
Data correspond to usage on the plateform after 2015. The current usage metrics is available 48-96 hours after online publication and is updated daily on week days.
Initial download of the metrics may take a while.