Fig. 1
Download original image
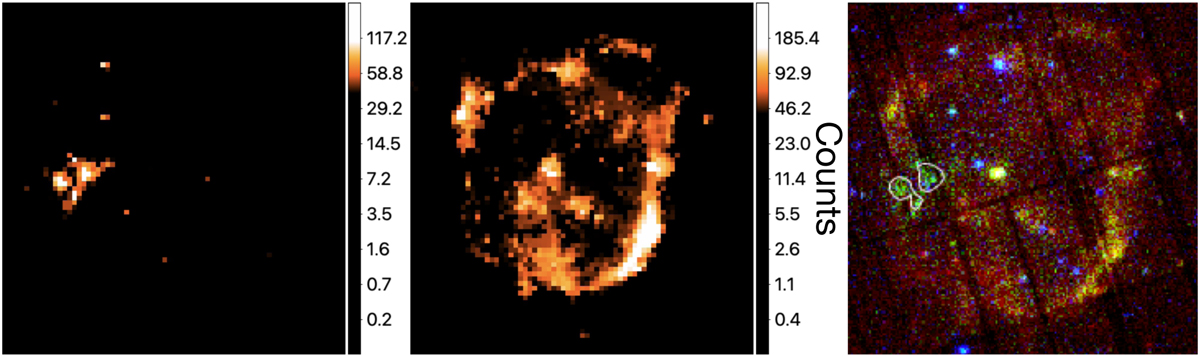
Thermal emission distribution in G330.2+1.0. The component retrieved by pGMCA that we identify as thermal emission is shown on the left. In the middle, we show the component retrieved by pGMCA that we identify as synchrotron emission. On the right, we show an XMM-Newton three-color image of G330.2+1.0, with 0.4–1.2 keV emission in red, 1.2–2.0 keV emission in green, and 2.0–7.0 keV emission in blue. The contours of our thermal emission component are overlaid in white; they appear in the green clump region that was studied in Williams et al. (2018) and shown to harbor thermal emission. The scales are logarithmic.
Current usage metrics show cumulative count of Article Views (full-text article views including HTML views, PDF and ePub downloads, according to the available data) and Abstracts Views on Vision4Press platform.
Data correspond to usage on the plateform after 2015. The current usage metrics is available 48-96 hours after online publication and is updated daily on week days.
Initial download of the metrics may take a while.