Fig. 8
Download original image
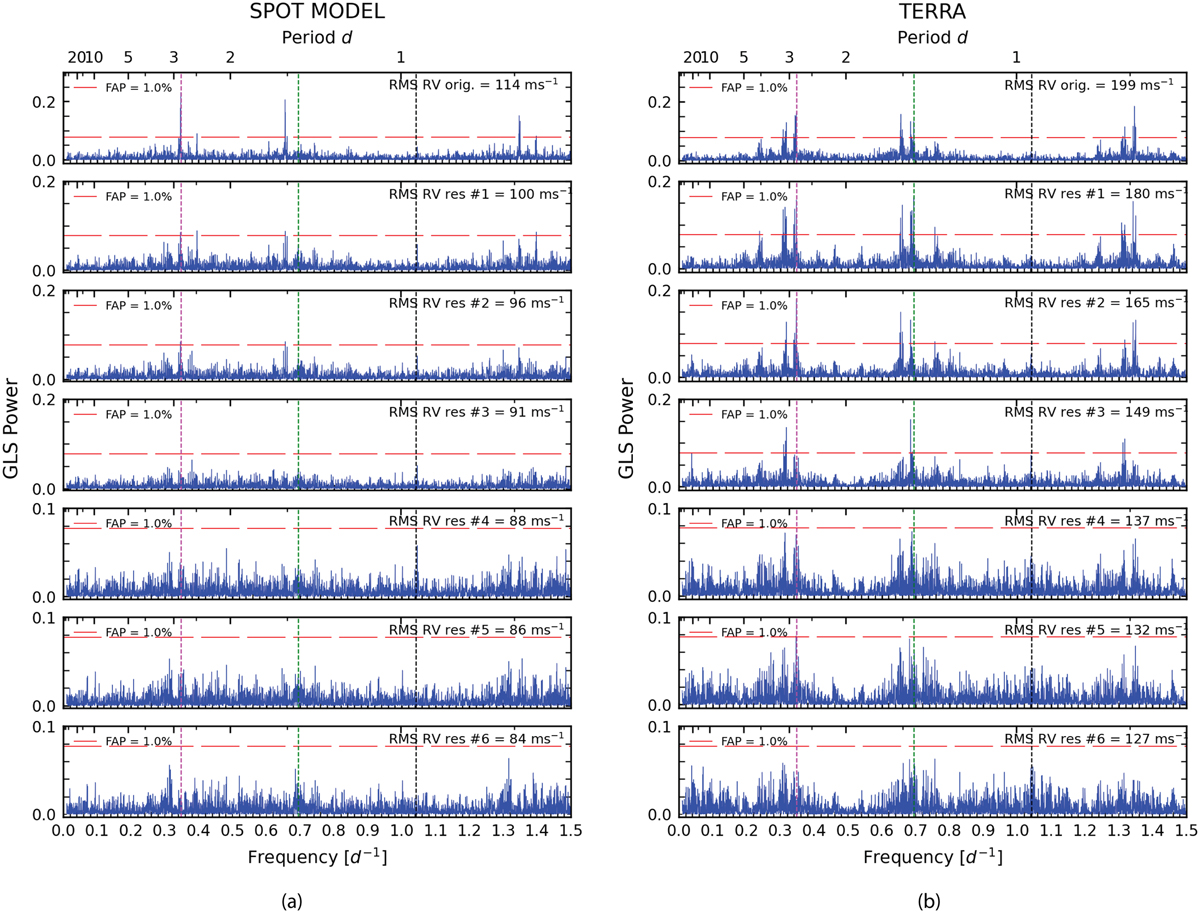
GLS periodogram of the V1298 Tau RVs obtained with the SpotCCF (panel a) and the TERRA (panel b) pipeline and their residuals after recursive prewhitening. In each panel, the vertical and dashed lines indicate the stellar rotation frequency (in magenta) and its harmonics (in green and black), and the horizontal red dashed line highlights the FAP at 1.0%. Each panel reports the RMS of the dataset.
Current usage metrics show cumulative count of Article Views (full-text article views including HTML views, PDF and ePub downloads, according to the available data) and Abstracts Views on Vision4Press platform.
Data correspond to usage on the plateform after 2015. The current usage metrics is available 48-96 hours after online publication and is updated daily on week days.
Initial download of the metrics may take a while.