Fig. 7
Download original image
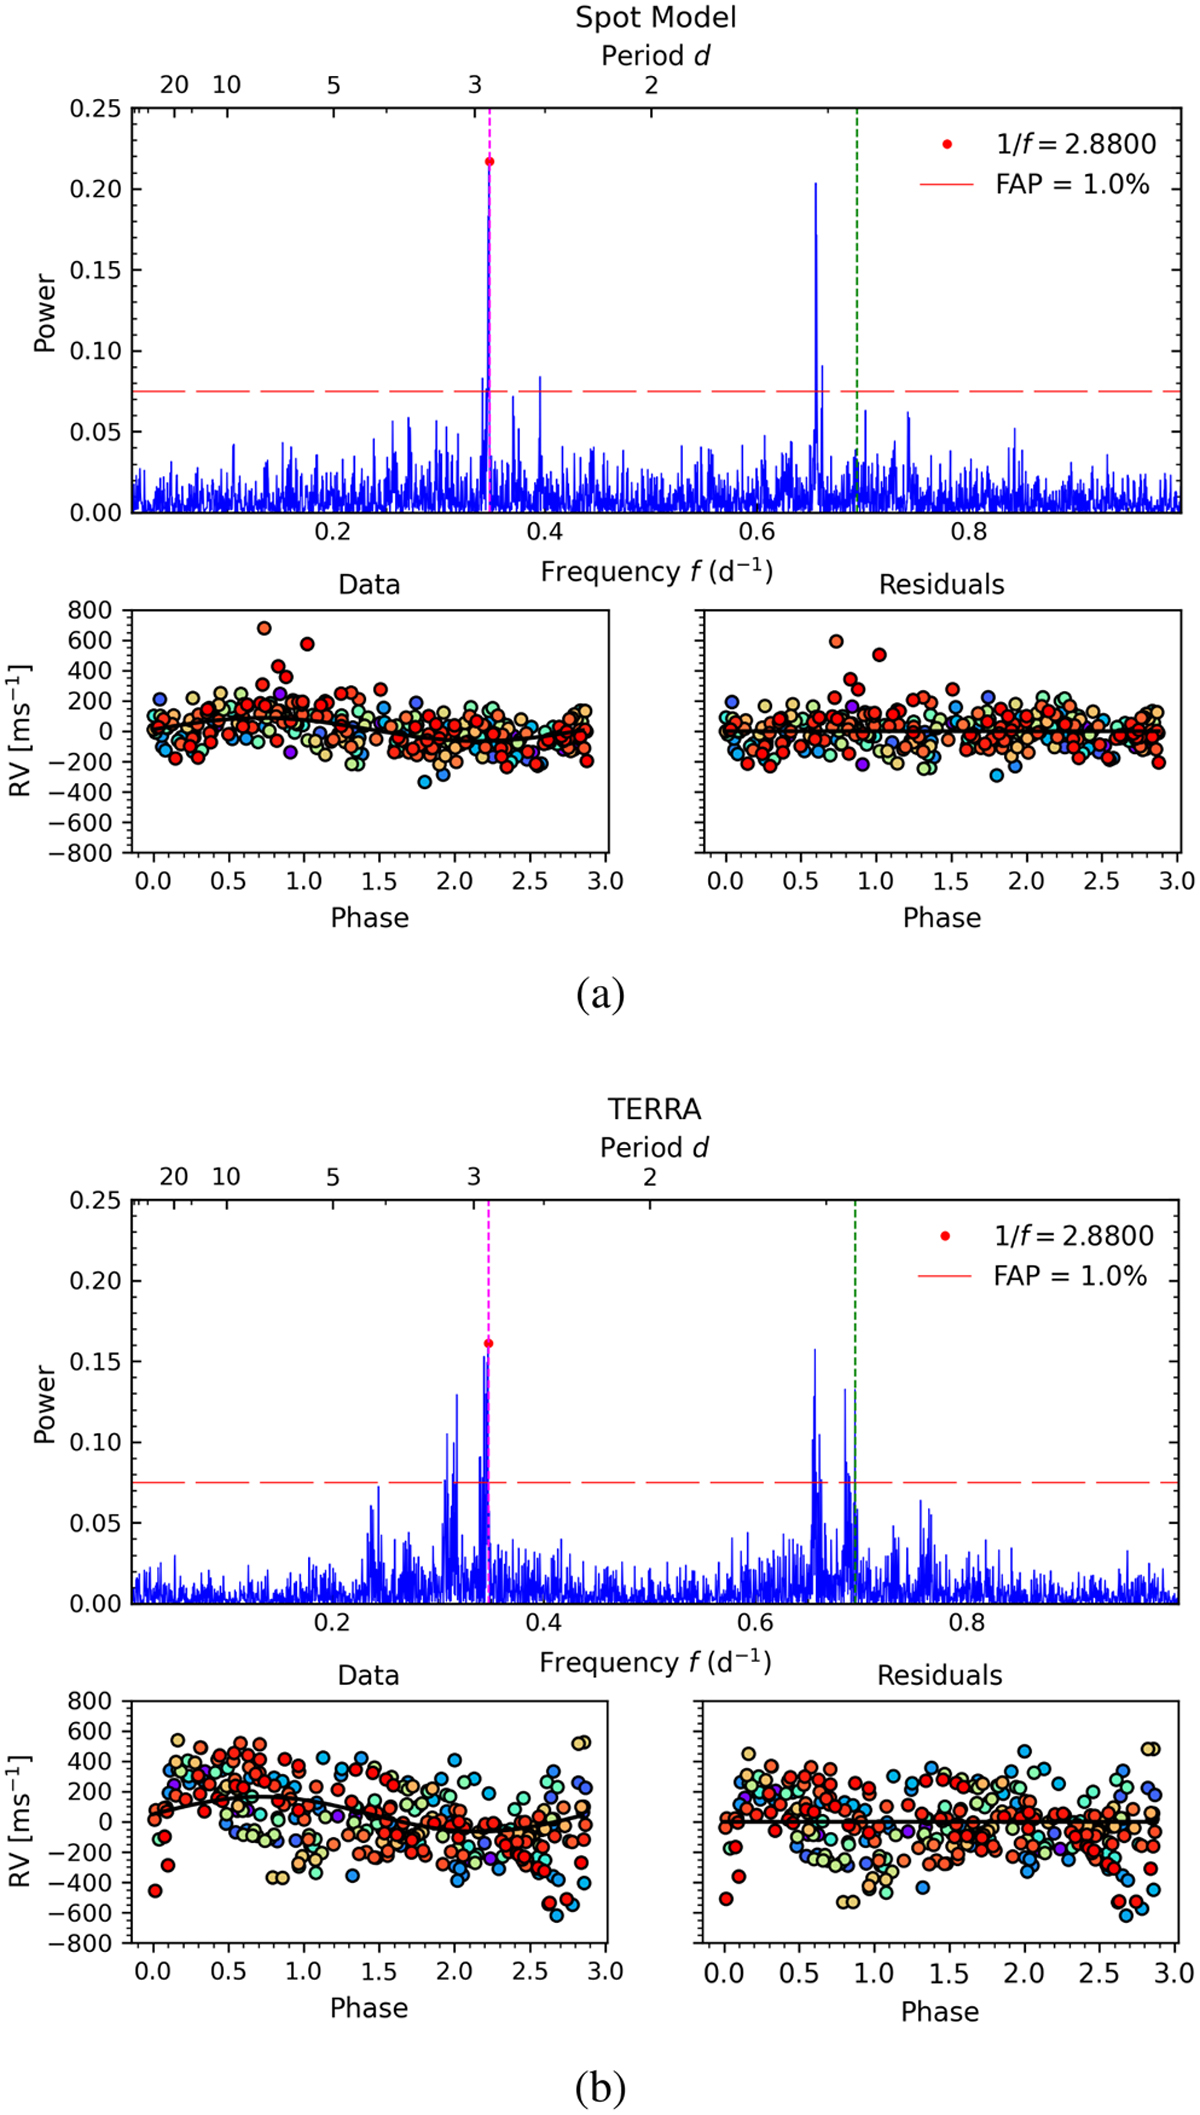
GLS periodogram of the V1298 Tau RVs obtained with the SpotCCF (panel a) and the TERRA pipeline (panel b). The red dots highlight the maximum power and the dashed red line indicates the FAP at 1.0% (upper panels). The vertical dashed magenta line highlights the Prot of the star, while the green dashed line indicates Prot/2. The bottom panels show the RVs (left) and the residuals (right) phase folded with the dominant period. The colour gradient, as shown in Fig. 6, helps in identifying the modulation in the phase-fold residuals across different observing seasons.
Current usage metrics show cumulative count of Article Views (full-text article views including HTML views, PDF and ePub downloads, according to the available data) and Abstracts Views on Vision4Press platform.
Data correspond to usage on the plateform after 2015. The current usage metrics is available 48-96 hours after online publication and is updated daily on week days.
Initial download of the metrics may take a while.