Fig. 4

Download original image
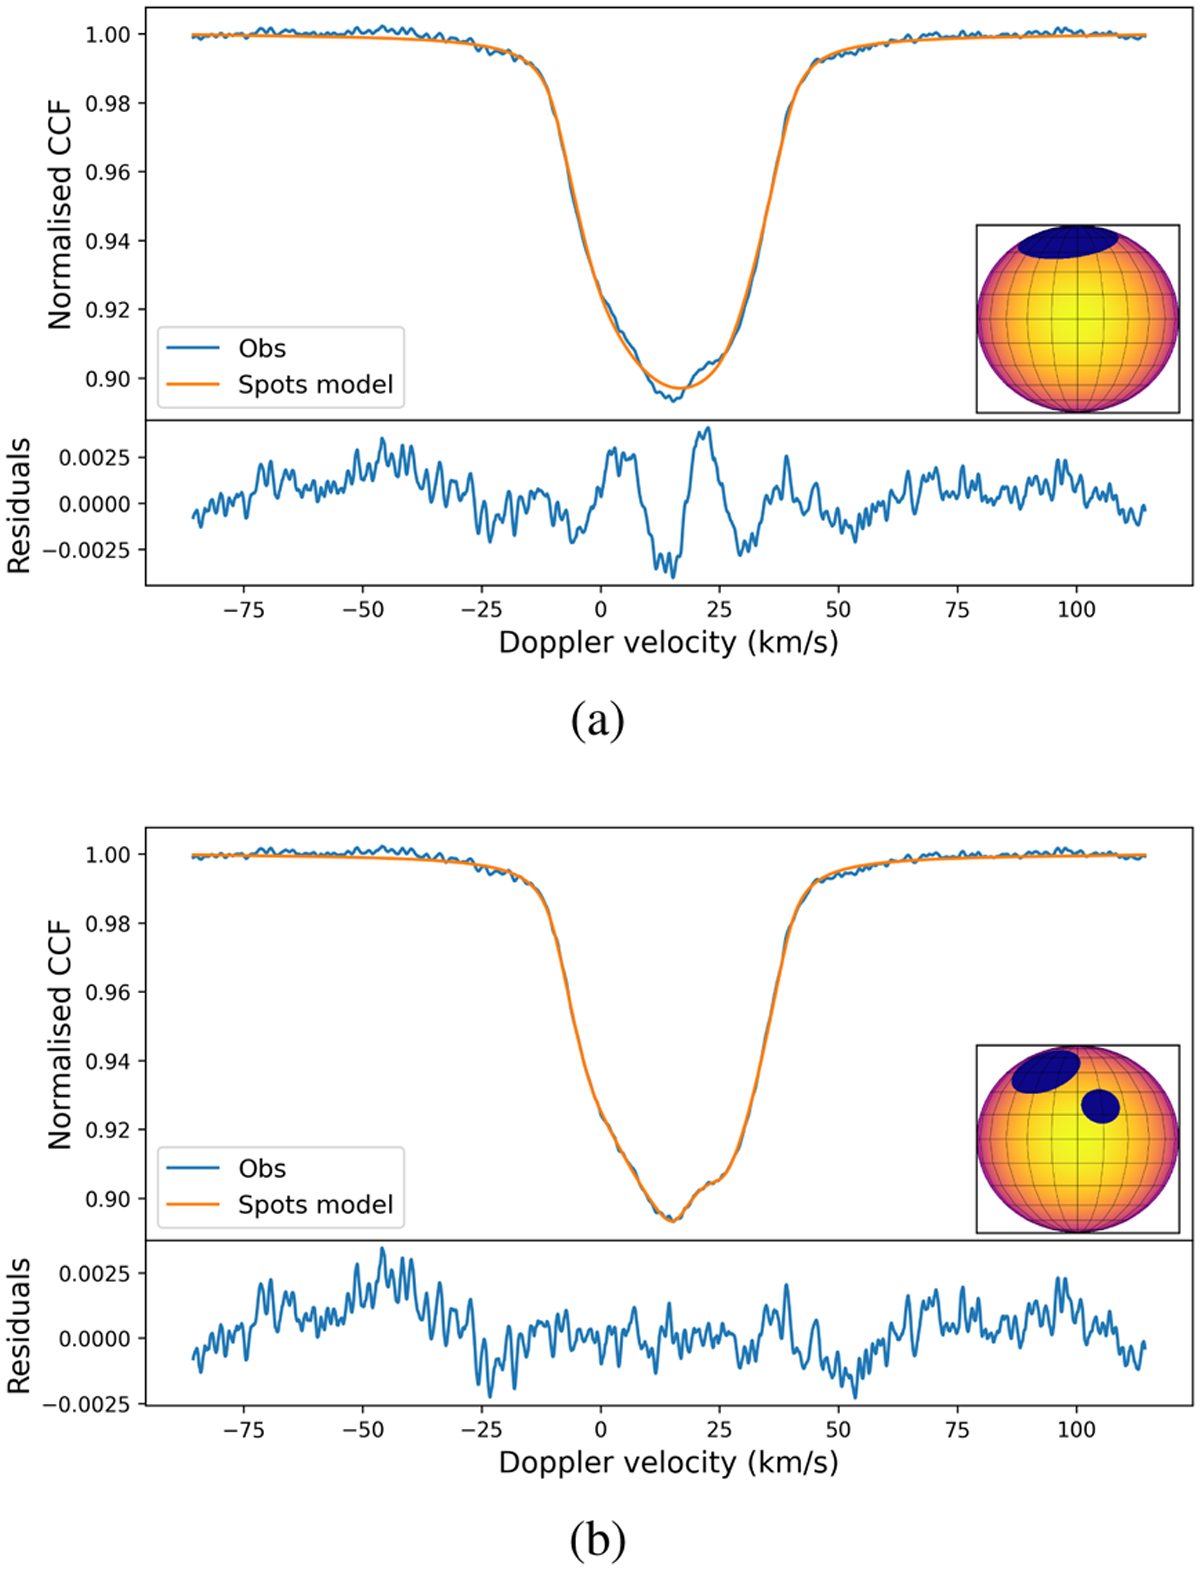
Examples of CCF profiles of V1298 Tau fitted with One-spot model (a) and Two-spots model (b) and the corresponding residuals (in bottom panels). The inset of each plot shows the location of the spots on the stellar disc, as defined by the fit of both models; the grid indicates longitudes and latitudes from −90 to 90 degrees with 15-degree intervals.
Current usage metrics show cumulative count of Article Views (full-text article views including HTML views, PDF and ePub downloads, according to the available data) and Abstracts Views on Vision4Press platform.
Data correspond to usage on the plateform after 2015. The current usage metrics is available 48-96 hours after online publication and is updated daily on week days.
Initial download of the metrics may take a while.


