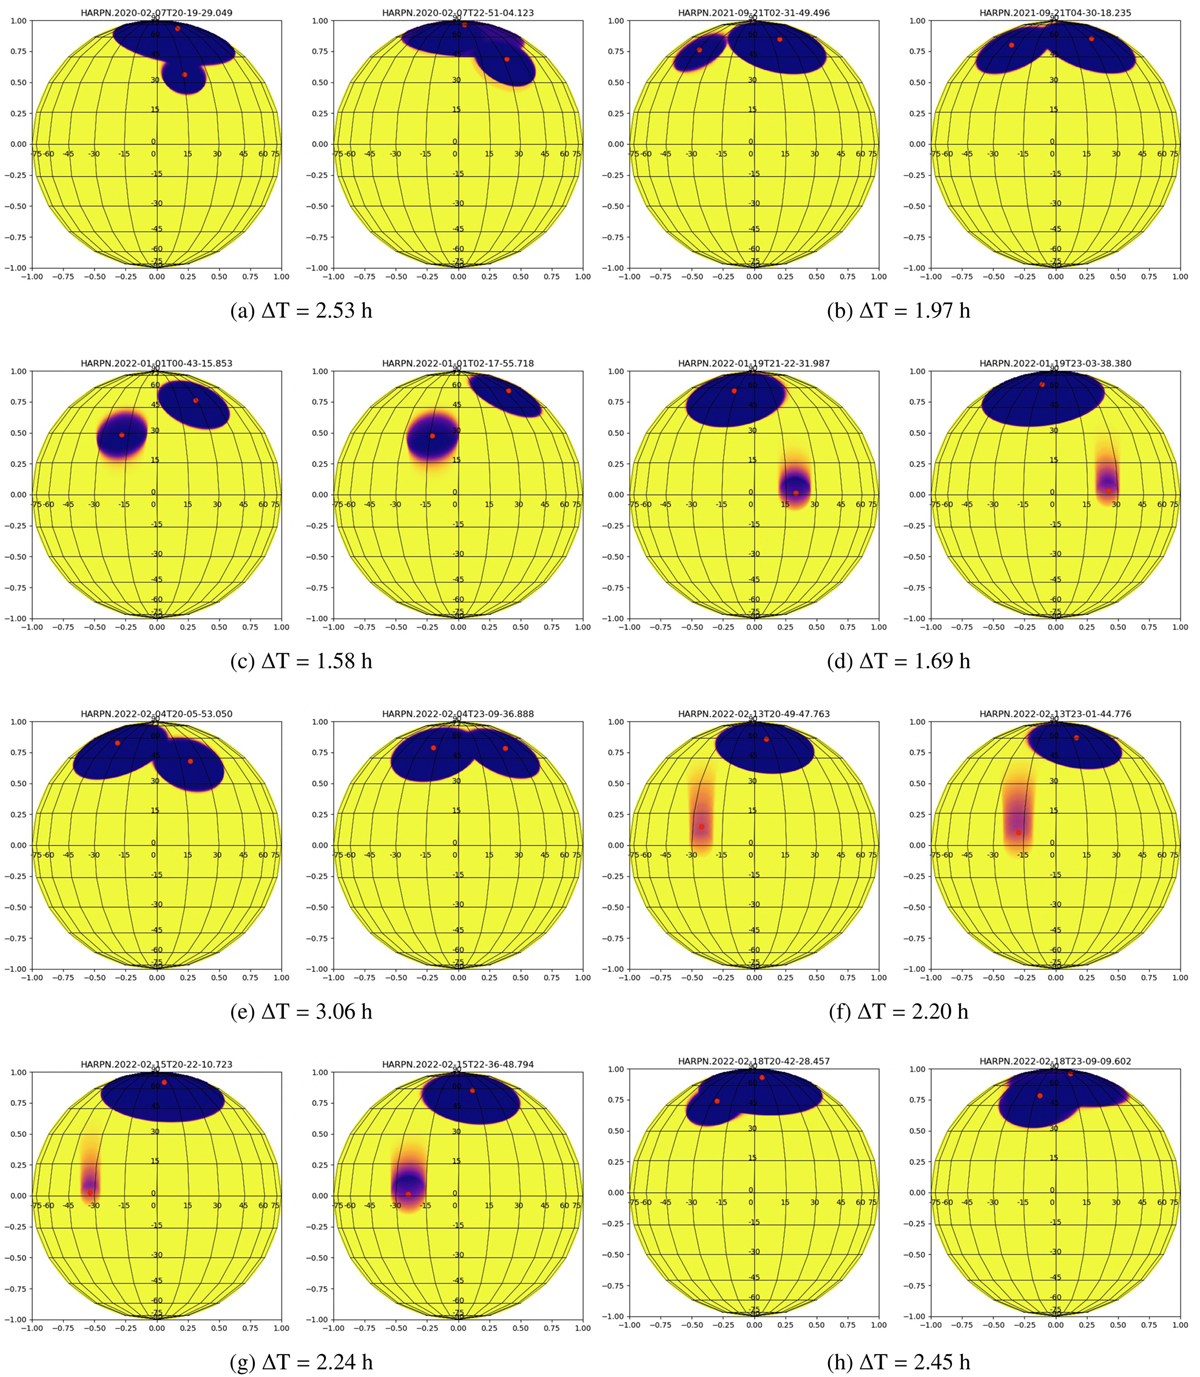
Fig. C.1
Download original image
Spot configuration of pairs of observations obtained at a few hours of distance. Each map shows the results obtained by the chain. At each step, the chain generates a map for each triplet of values (latitude, longitude, and radius), drawing the corresponding spot on the stellar surface. The final map, as well as those shown in this figure, is obtained by summing the individual maps obtained at each step of the chain using a colour scale ranging from red to blue. The bluest area on the map represents the final configuration of each spot determined by the chain.
Current usage metrics show cumulative count of Article Views (full-text article views including HTML views, PDF and ePub downloads, according to the available data) and Abstracts Views on Vision4Press platform.
Data correspond to usage on the plateform after 2015. The current usage metrics is available 48-96 hours after online publication and is updated daily on week days.
Initial download of the metrics may take a while.