Fig. B.1
Download original image
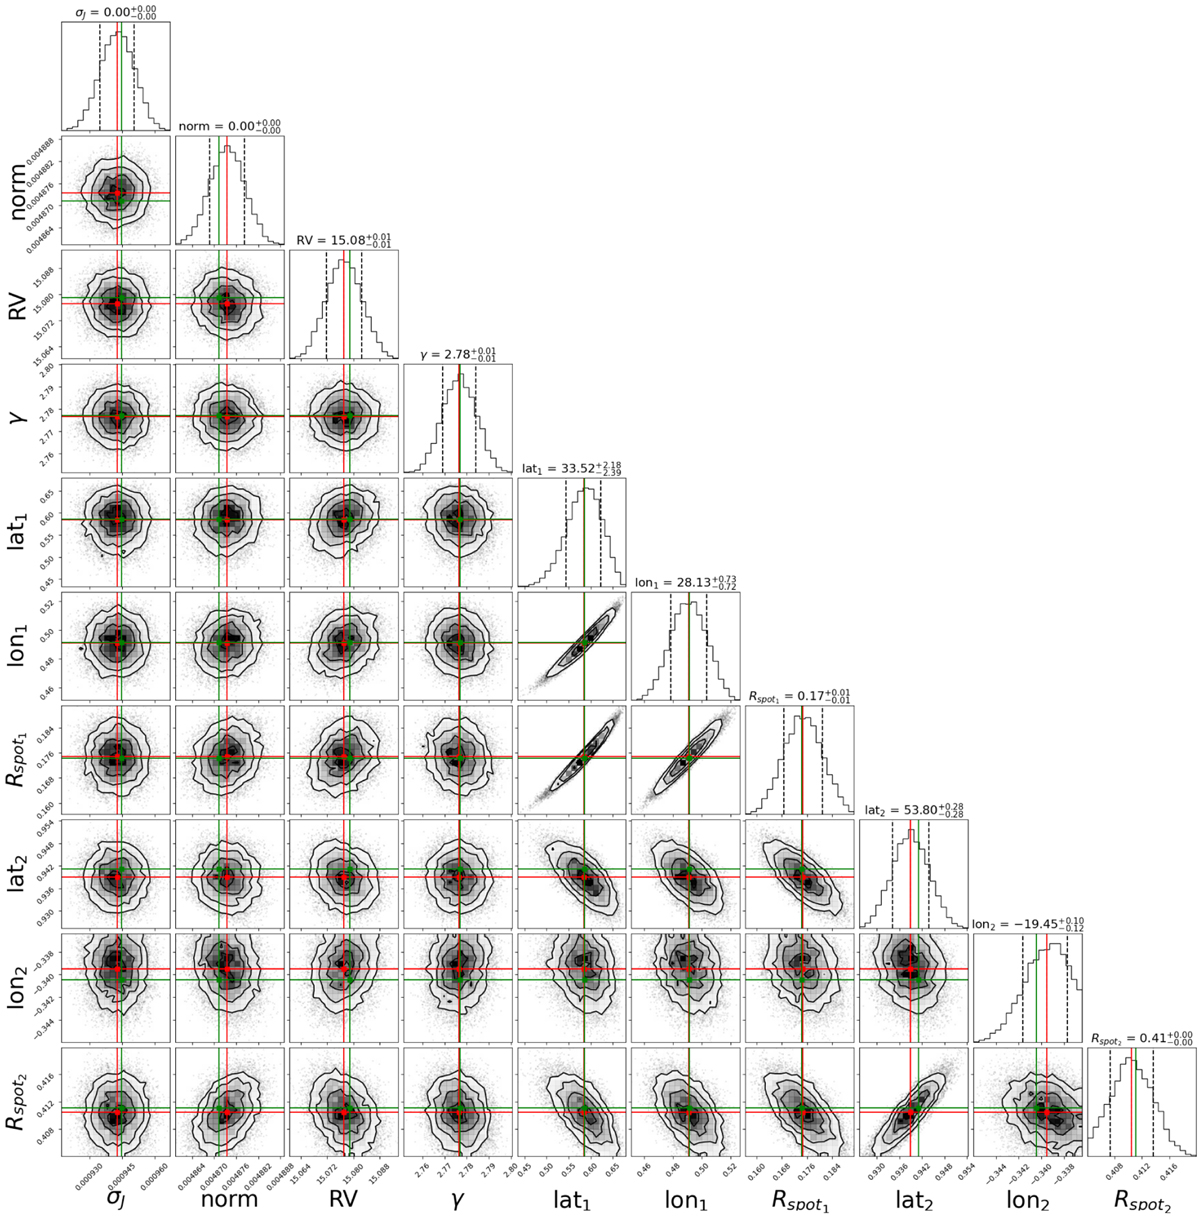
Example corner plot of the best-fit parameters obtained from the fitting of a CCF profile of V1298 Tau with the Two-spots model. The red and green lines mark the median and the maximum-a posteriori values, respectively, while the dashed black lines are the 16th and 84th quantiles. The median ± 1σ values are reported in the title of each histogram. The latitude and longitude scales are in radians. log Z = 31005
Current usage metrics show cumulative count of Article Views (full-text article views including HTML views, PDF and ePub downloads, according to the available data) and Abstracts Views on Vision4Press platform.
Data correspond to usage on the plateform after 2015. The current usage metrics is available 48-96 hours after online publication and is updated daily on week days.
Initial download of the metrics may take a while.