Fig. 12
Download original image
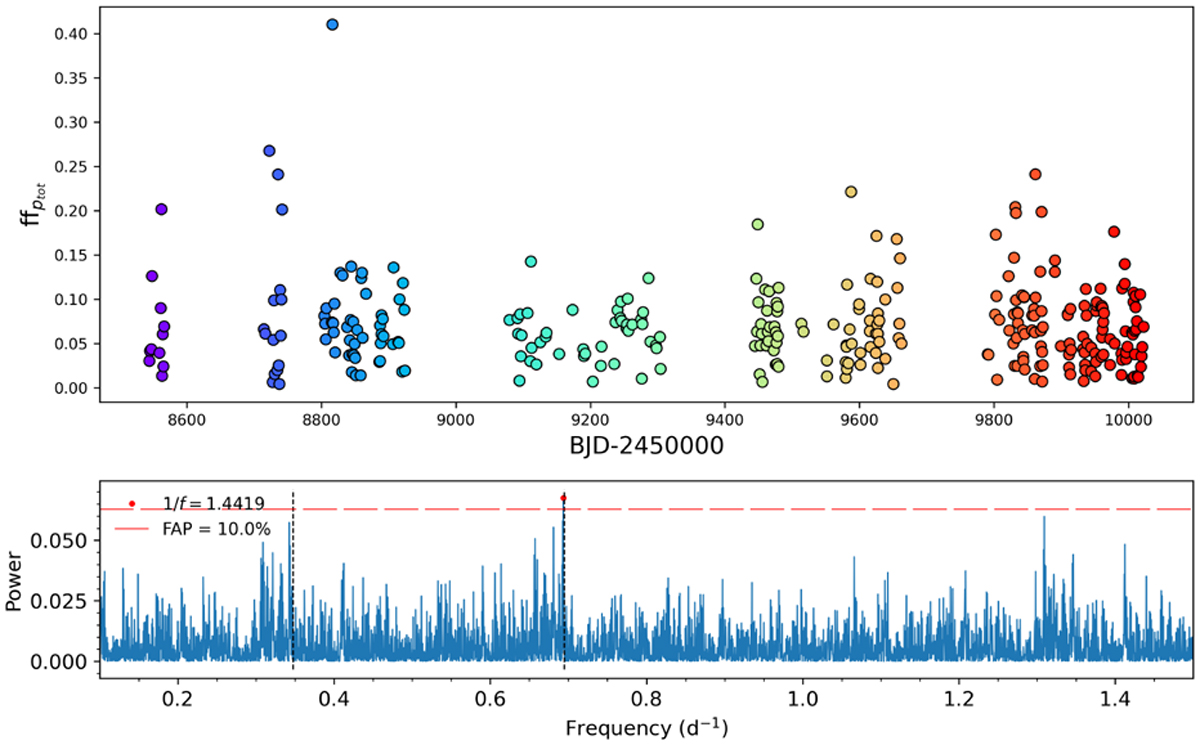
Total projected filling factor time series of V1298 Tau (upper panel) and corresponding GLS periodogram (lower panel). The points are coloured following a colour scale from blue to red as a function of the observation time. The red horizontal line in the periodogram indicates the FAP level at 10%, while the black dashed lines highlight the rotational period of the star and its harmonic.
Current usage metrics show cumulative count of Article Views (full-text article views including HTML views, PDF and ePub downloads, according to the available data) and Abstracts Views on Vision4Press platform.
Data correspond to usage on the plateform after 2015. The current usage metrics is available 48-96 hours after online publication and is updated daily on week days.
Initial download of the metrics may take a while.