Fig. 10
Download original image
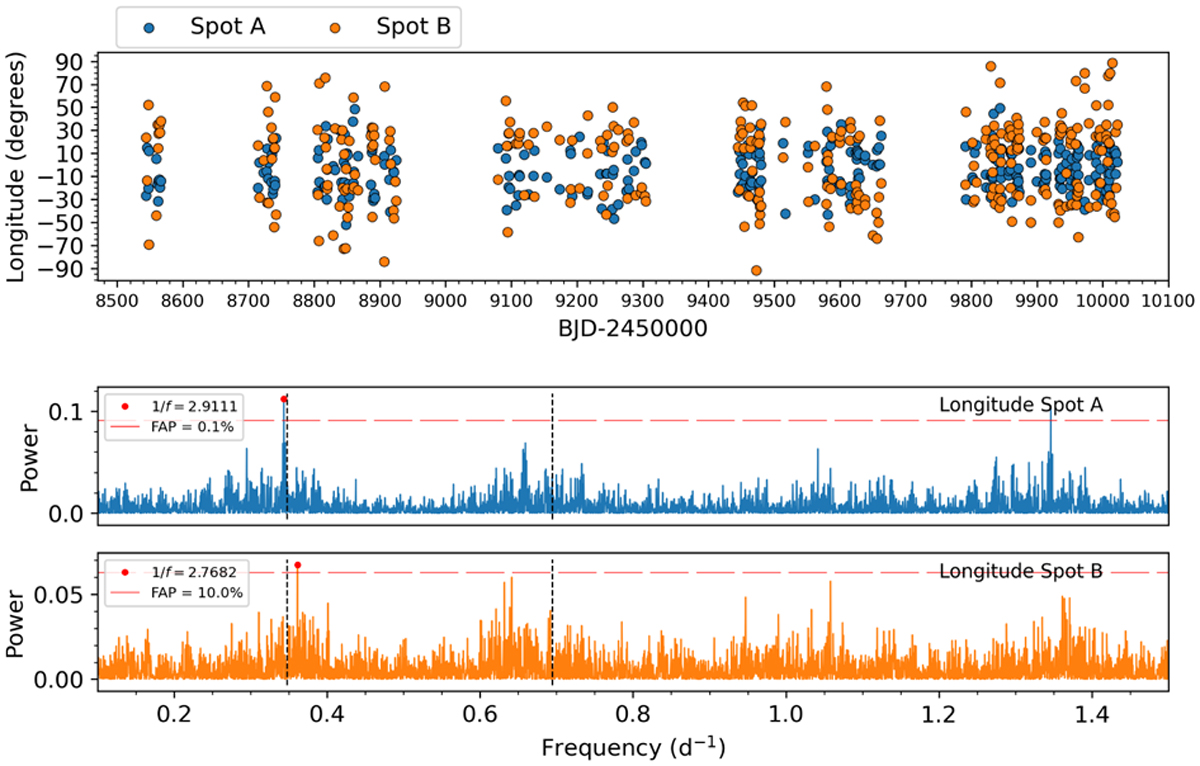
V1298 Tau longitudes time-series (upper panel). The blue points indicate the large spots (Spot A), while the orange points are the small spots (Spot B). GLS periodogram performed for the longitude values obtained for Spot A and Spot B, respectively (lower panels). The red horizontal line indicates the FAP level at 0.1% and 10%, respectively. The black dashed lines highlight the rotational period of the star and its harmonic.
Current usage metrics show cumulative count of Article Views (full-text article views including HTML views, PDF and ePub downloads, according to the available data) and Abstracts Views on Vision4Press platform.
Data correspond to usage on the plateform after 2015. The current usage metrics is available 48-96 hours after online publication and is updated daily on week days.
Initial download of the metrics may take a while.