Open Access
Fig. 2.
Download original image
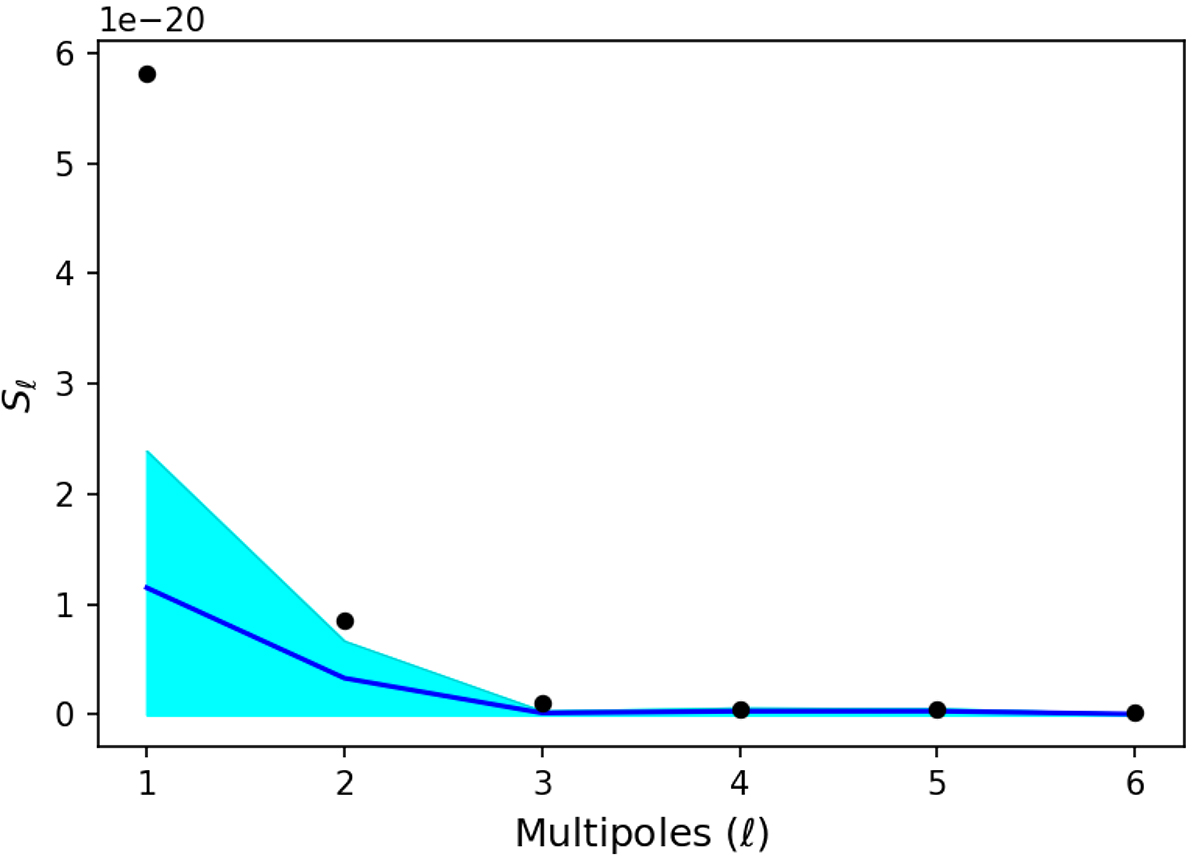
Angular power spectrum of the Commander-σ map (dots), shown in Fig. 1, where the continuous blue line corresponds to the mean angular power spectrum of the MC-σ map set, and the shaded region corresponds to 2σ CL.
Current usage metrics show cumulative count of Article Views (full-text article views including HTML views, PDF and ePub downloads, according to the available data) and Abstracts Views on Vision4Press platform.
Data correspond to usage on the plateform after 2015. The current usage metrics is available 48-96 hours after online publication and is updated daily on week days.
Initial download of the metrics may take a while.