Fig. 7.
Download original image
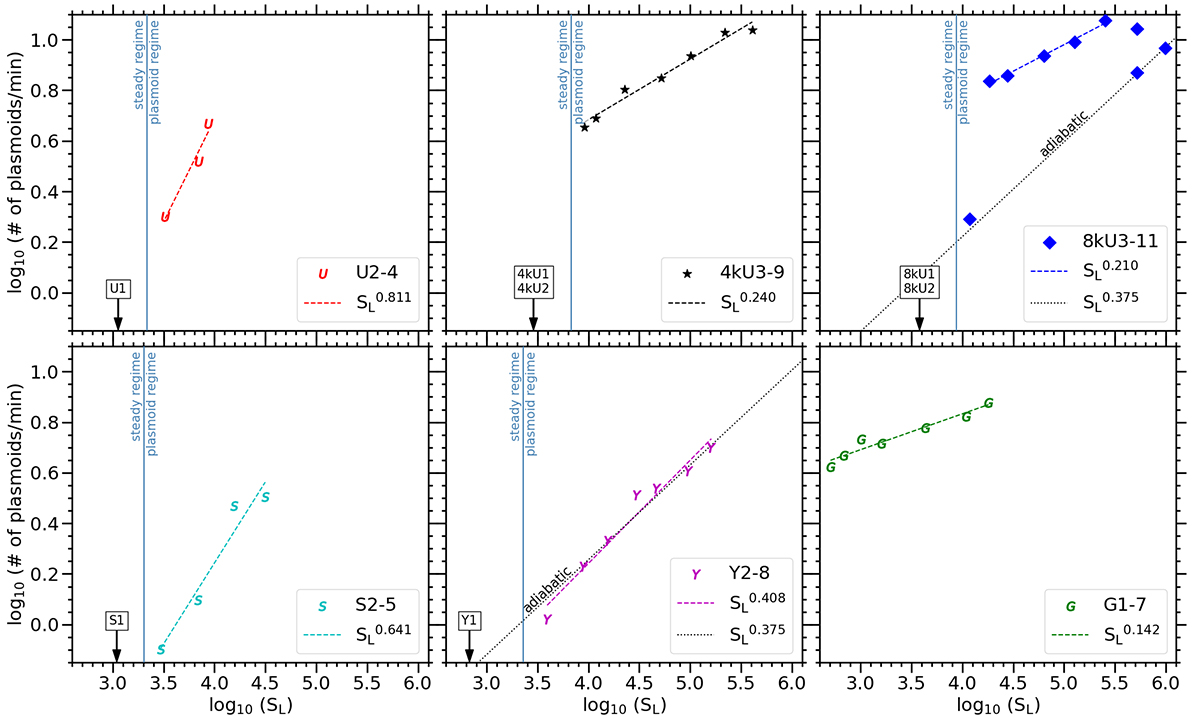
Plasmoid frequency, measured as the number of plasmoids generated along the current sheet per minute, plotted against Lundquist number SL for each simulation case. Results are displayed for cases with uniform resistivity (top panels, with 2k, 4k, and 8k cases in separate panels) and anomalous resistivity (bottom panels, with Syntelis-19, YS-94, and Gudiksen-11 cases in separate panels). For cases within a certain range of Lundquist numbers, the plasmoid frequency scales roughly with Lundquist number by a power law ![]() , and best-fit curves for these cases are plotted as dashed lines in each panel. The curve for the adiabatic power law
, and best-fit curves for these cases are plotted as dashed lines in each panel. The curve for the adiabatic power law ![]() is plotted as a dotted line for the cases where a nearly adiabatic scaling between plasmoid number and Lundquist number occur. A vertical line marks the Lundquist number below which steady reconnection occurs and above which plasmoid-mediated reconnection occurs. Cases U1, 4kU1-2, 8kU1-2, S1, and Y1 have no plasmoids, as indicated by the label placed inside the steady-reconnection regime.
is plotted as a dotted line for the cases where a nearly adiabatic scaling between plasmoid number and Lundquist number occur. A vertical line marks the Lundquist number below which steady reconnection occurs and above which plasmoid-mediated reconnection occurs. Cases U1, 4kU1-2, 8kU1-2, S1, and Y1 have no plasmoids, as indicated by the label placed inside the steady-reconnection regime.
Current usage metrics show cumulative count of Article Views (full-text article views including HTML views, PDF and ePub downloads, according to the available data) and Abstracts Views on Vision4Press platform.
Data correspond to usage on the plateform after 2015. The current usage metrics is available 48-96 hours after online publication and is updated daily on week days.
Initial download of the metrics may take a while.