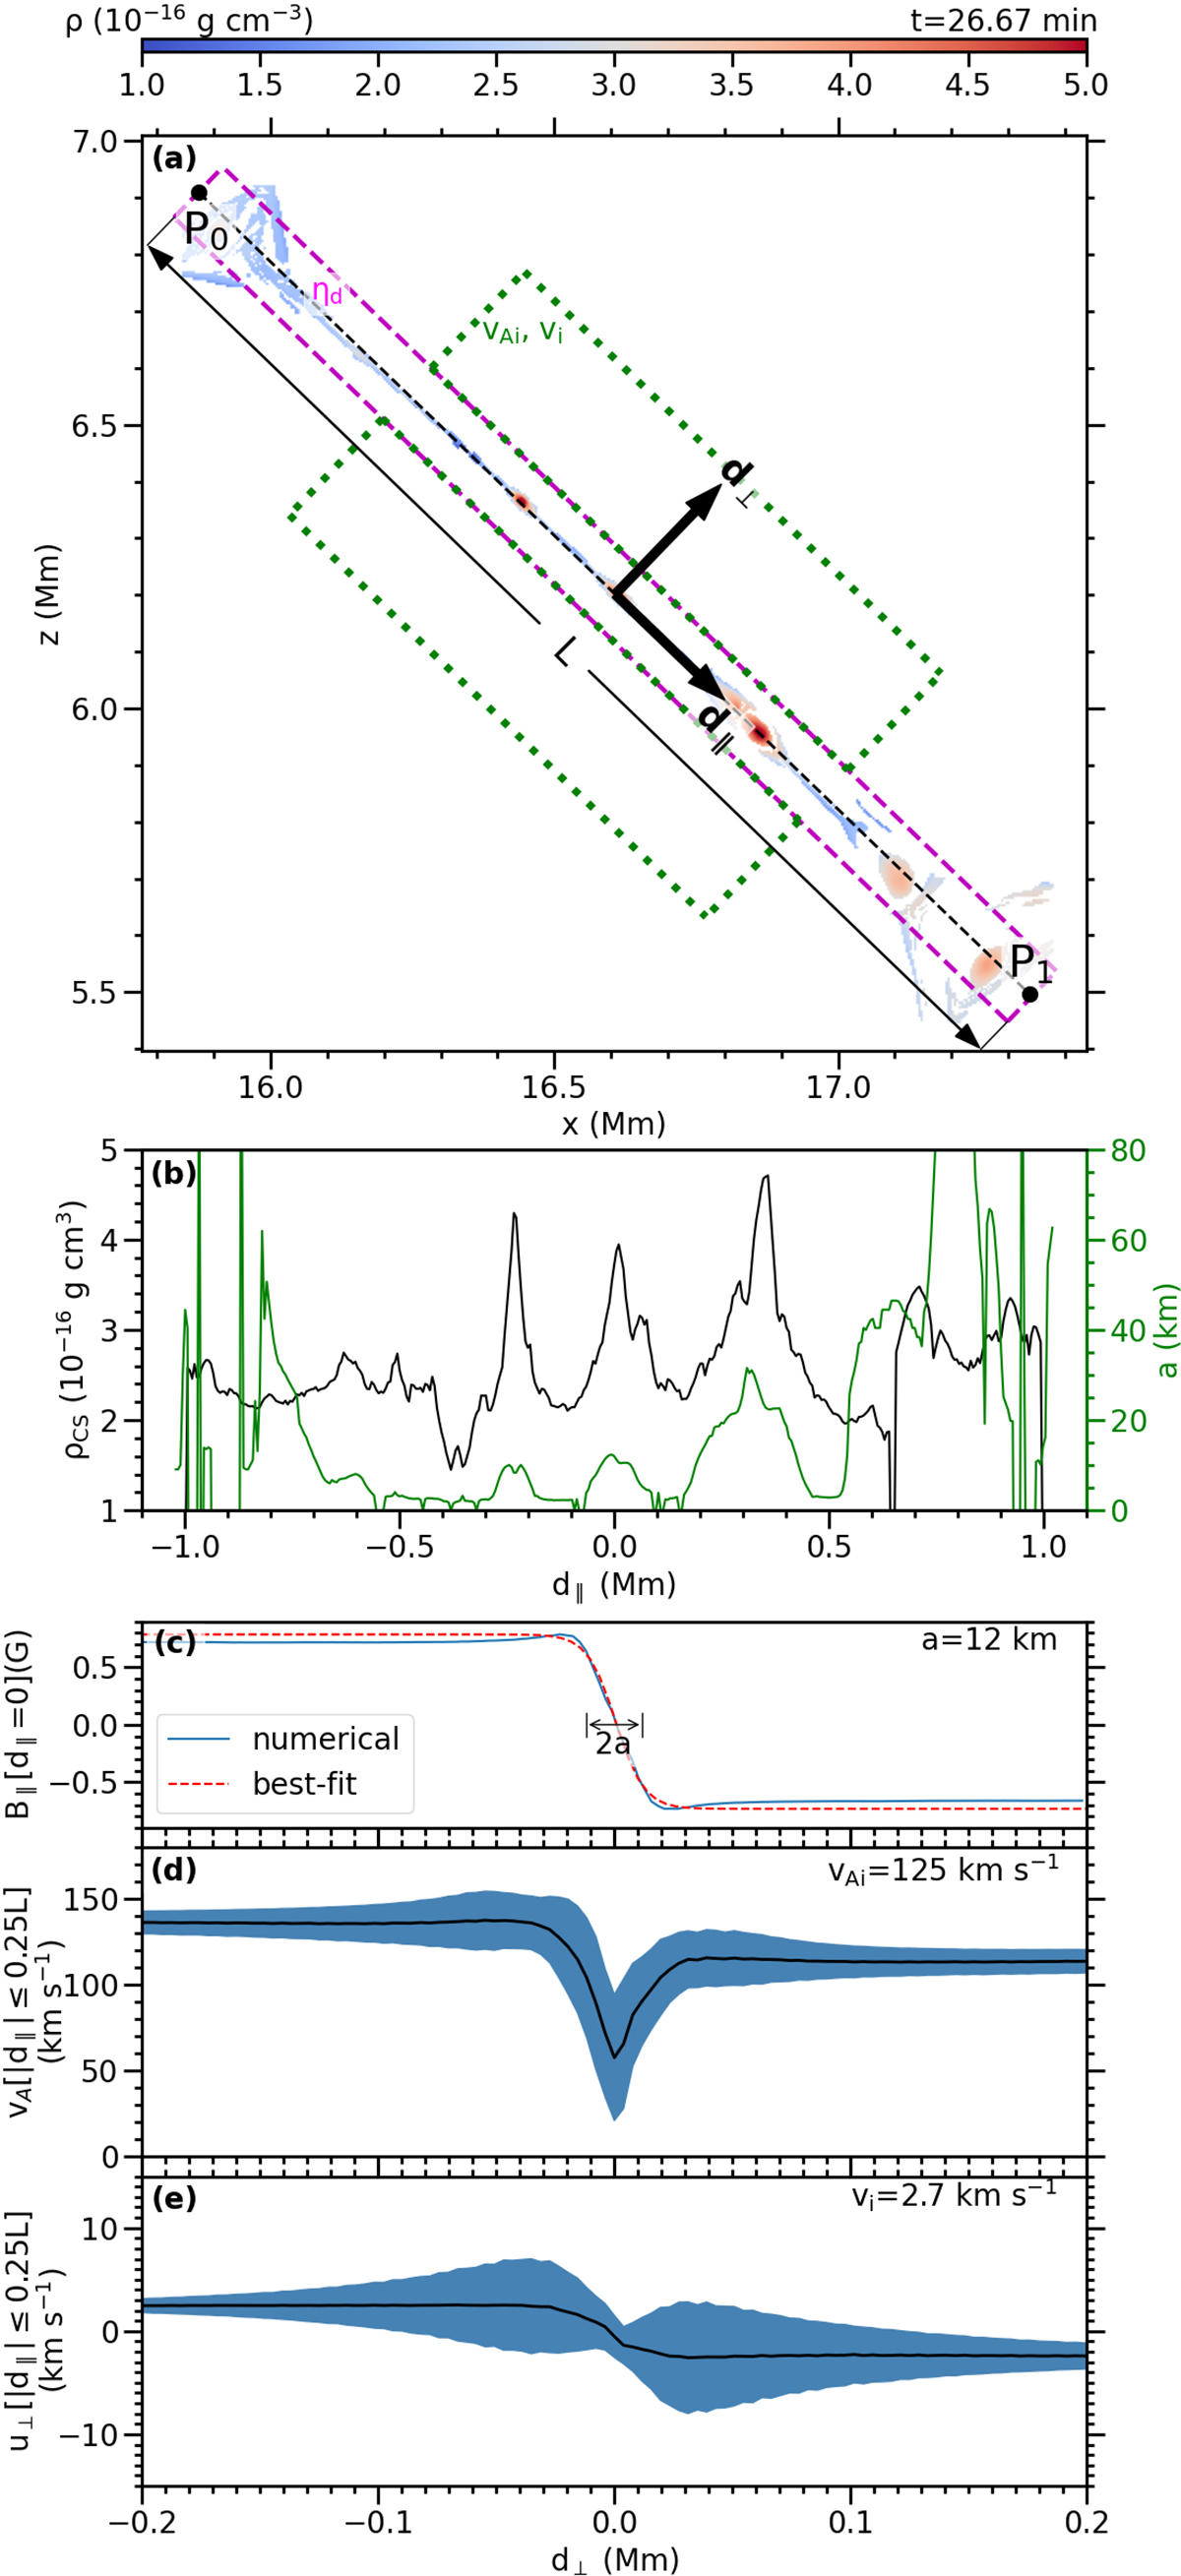
Fig. 4.
Download original image
Characteristics of the current sheet (case 8kU6). Panel (a): Mass density ρ in the current sheet, mapped for LB ≤ 20 km. The dashed line with endpoints P0 to P1 marks the current sheet, with coordinate axes for d∥ and d⊥ plotted in. Diffusion and inflow regions are delimited by magenta and green rectangles, respectively. Panel (b): Average density ρCS (black curve) and width a (green curve) of the current sheet. Panel (c): Parallel component of magnetic field, B∥ (blue), across the current sheet and the best-fit (red) curve used to estimate a at d∥ = 0. Panels (d) and (e): Alfvén velocity vA (d) and perpendicular velocity u⊥ (e) across the current sheet. Blue area maps the ranges of all values for |d∥|≤0.25L, and black curve plots the average. Estimated inflow region mean values are printed in top right corner.
Current usage metrics show cumulative count of Article Views (full-text article views including HTML views, PDF and ePub downloads, according to the available data) and Abstracts Views on Vision4Press platform.
Data correspond to usage on the plateform after 2015. The current usage metrics is available 48-96 hours after online publication and is updated daily on week days.
Initial download of the metrics may take a while.