Fig. 6
Download original image
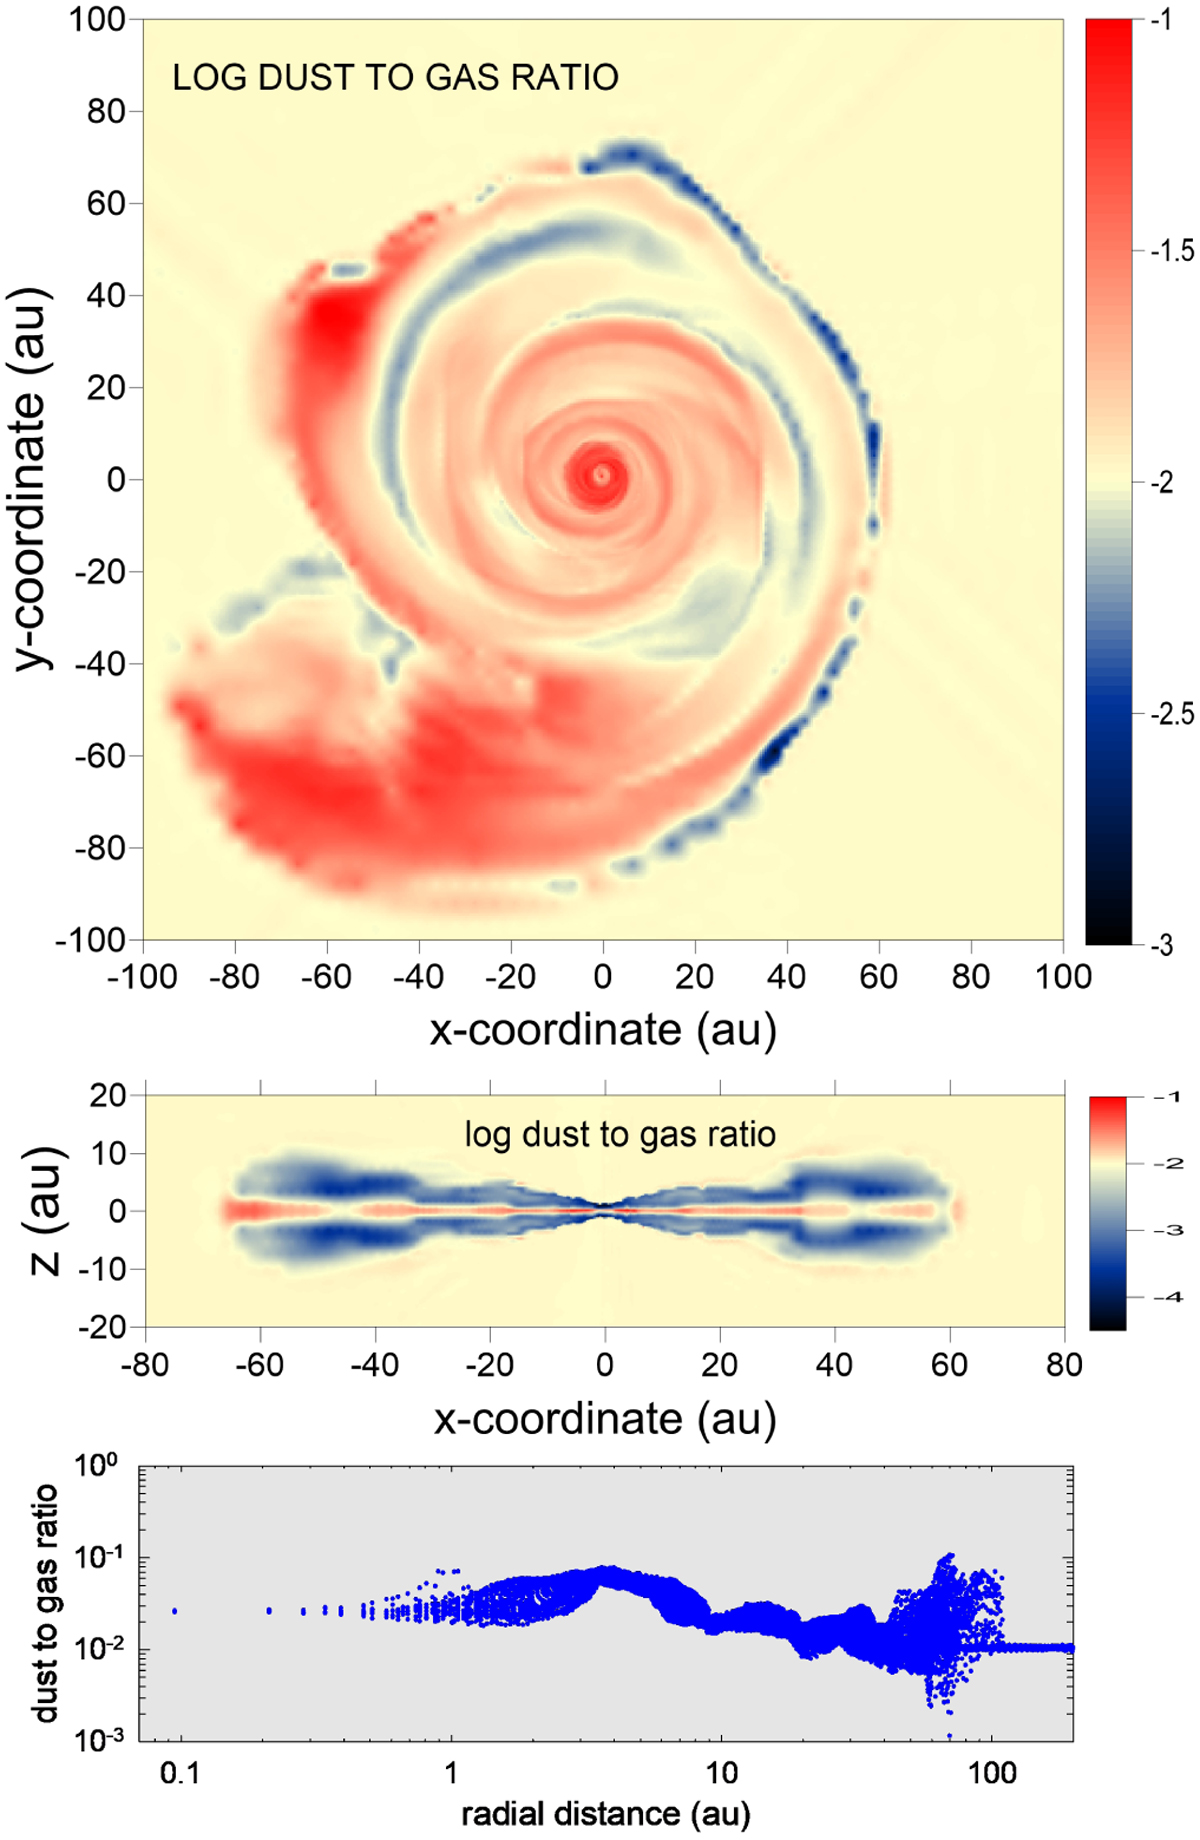
Total dust-to-gas mass ratio at t = 18 kyr. The top panel shows the two-dimensional distribution in the disk midplane, while the middle panel presents the data across the vertical cut taken at y = 0. The bottom panel is the dust-to-gas ratio as a function of radial distance in the disk midplane in all directions. The color bars in the top and middle panels are in log units.
Current usage metrics show cumulative count of Article Views (full-text article views including HTML views, PDF and ePub downloads, according to the available data) and Abstracts Views on Vision4Press platform.
Data correspond to usage on the plateform after 2015. The current usage metrics is available 48-96 hours after online publication and is updated daily on week days.
Initial download of the metrics may take a while.