Fig. 5
Download original image
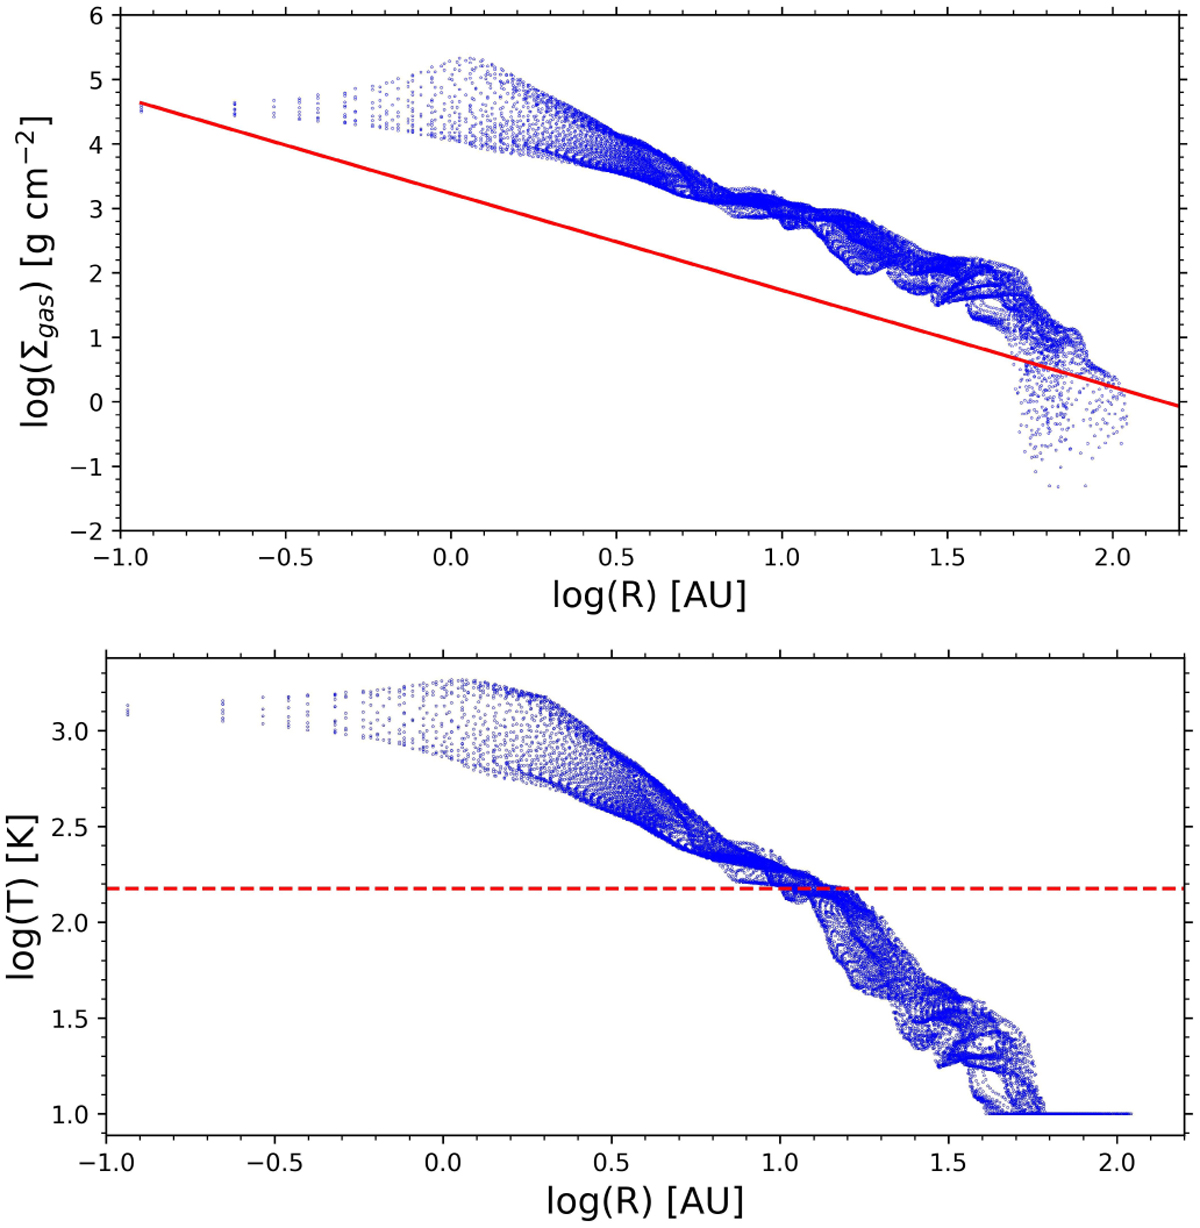
Comparison of the gas surface density and temperature in our model with those of the MMSN. The blue dots in the top and bottom panels are the model gas surface densities and temperatures at t = 18 kyr, respectively. The red line in the top panel shows the surface density profile for the MMSN. The dashed horizontal line in the bottom panel marks the gas temperature of 150 K, taken to be the water sublimation temperature.
Current usage metrics show cumulative count of Article Views (full-text article views including HTML views, PDF and ePub downloads, according to the available data) and Abstracts Views on Vision4Press platform.
Data correspond to usage on the plateform after 2015. The current usage metrics is available 48-96 hours after online publication and is updated daily on week days.
Initial download of the metrics may take a while.