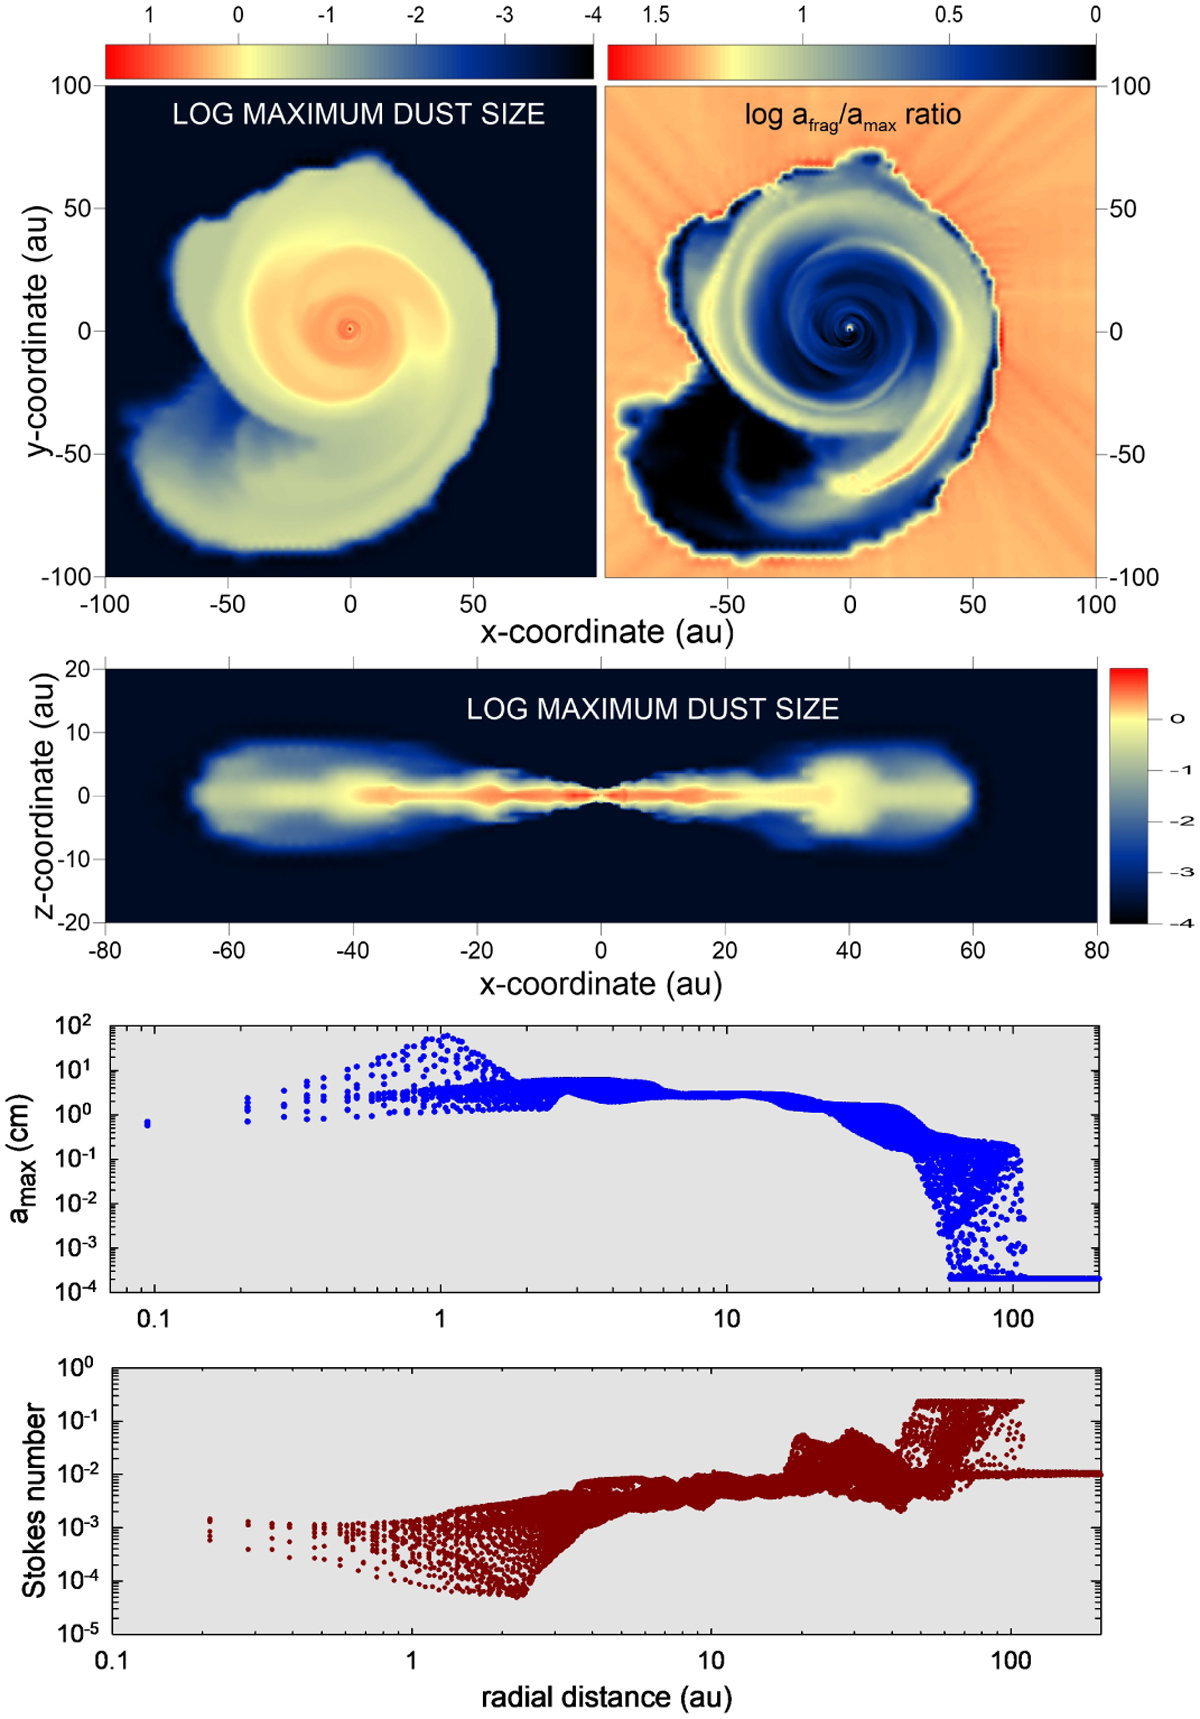
Fig. 4
Download original image
Spatial and radial distribution of the maximum dust size amax and the Stokes number at t = 18 kyr. The top row consists of two sub-panels: the left-hand side subpanel showing amax and right-hand side one presenting the ratio of the fragmentation barrier afrag to the actual maximum size of dust grains amax, both in the disk midplane. The second row is the vertical cut taken across the disk at y = 0, third and bottom rows are amax and St, respectively, as a function of radial distance in the disk midplane in all directions. The scale bars for amax are in log cm, while the color bar for afrag/amax is in log dimensionless units.
Current usage metrics show cumulative count of Article Views (full-text article views including HTML views, PDF and ePub downloads, according to the available data) and Abstracts Views on Vision4Press platform.
Data correspond to usage on the plateform after 2015. The current usage metrics is available 48-96 hours after online publication and is updated daily on week days.
Initial download of the metrics may take a while.