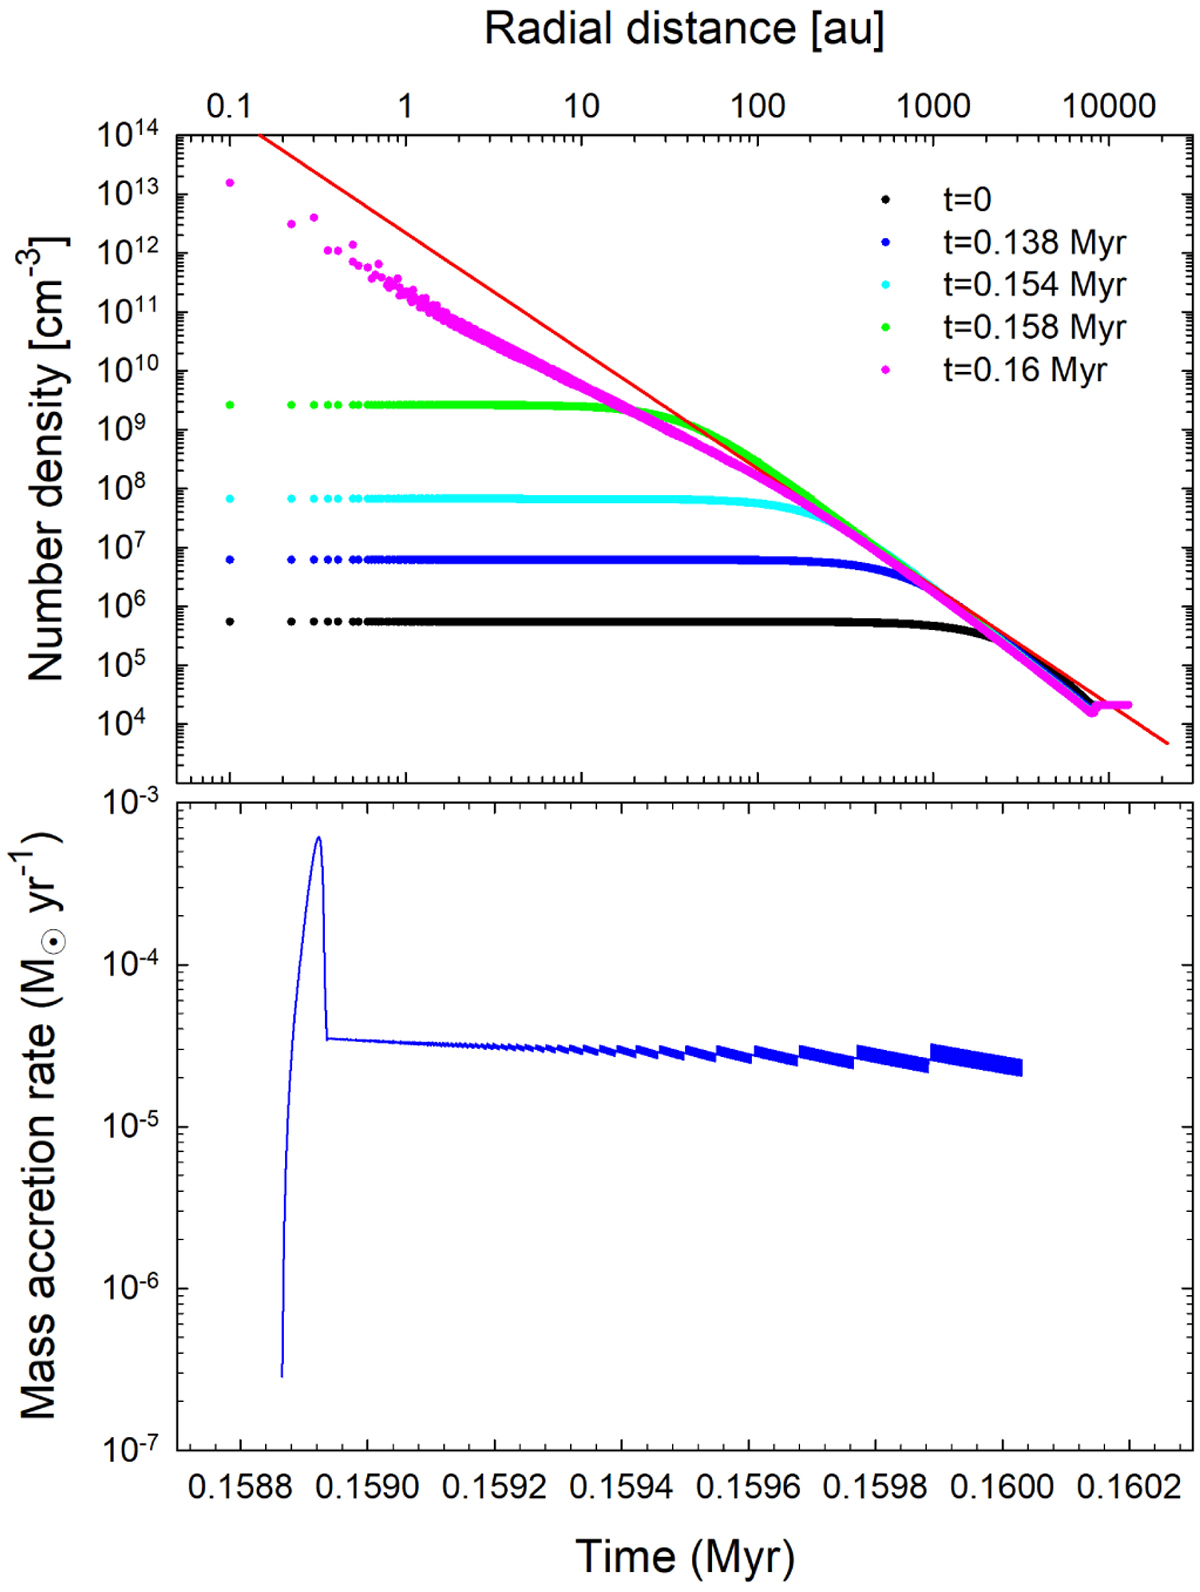
Fig. C.12
Download original image
Collapse of a gaseous sphere followed by star formation and protostellar accretion. The top panel shows the radial distributions of the gas number density at different time instances during the collapse and after the formation of the star. The red line is the fit to Eq. (C.12) with A = 5. The bottom panel displays the resulting mass accretion on to the star. The time is counted from the onset of simulations.
Current usage metrics show cumulative count of Article Views (full-text article views including HTML views, PDF and ePub downloads, according to the available data) and Abstracts Views on Vision4Press platform.
Data correspond to usage on the plateform after 2015. The current usage metrics is available 48-96 hours after online publication and is updated daily on week days.
Initial download of the metrics may take a while.