Open Access
Fig. 1
Download original image
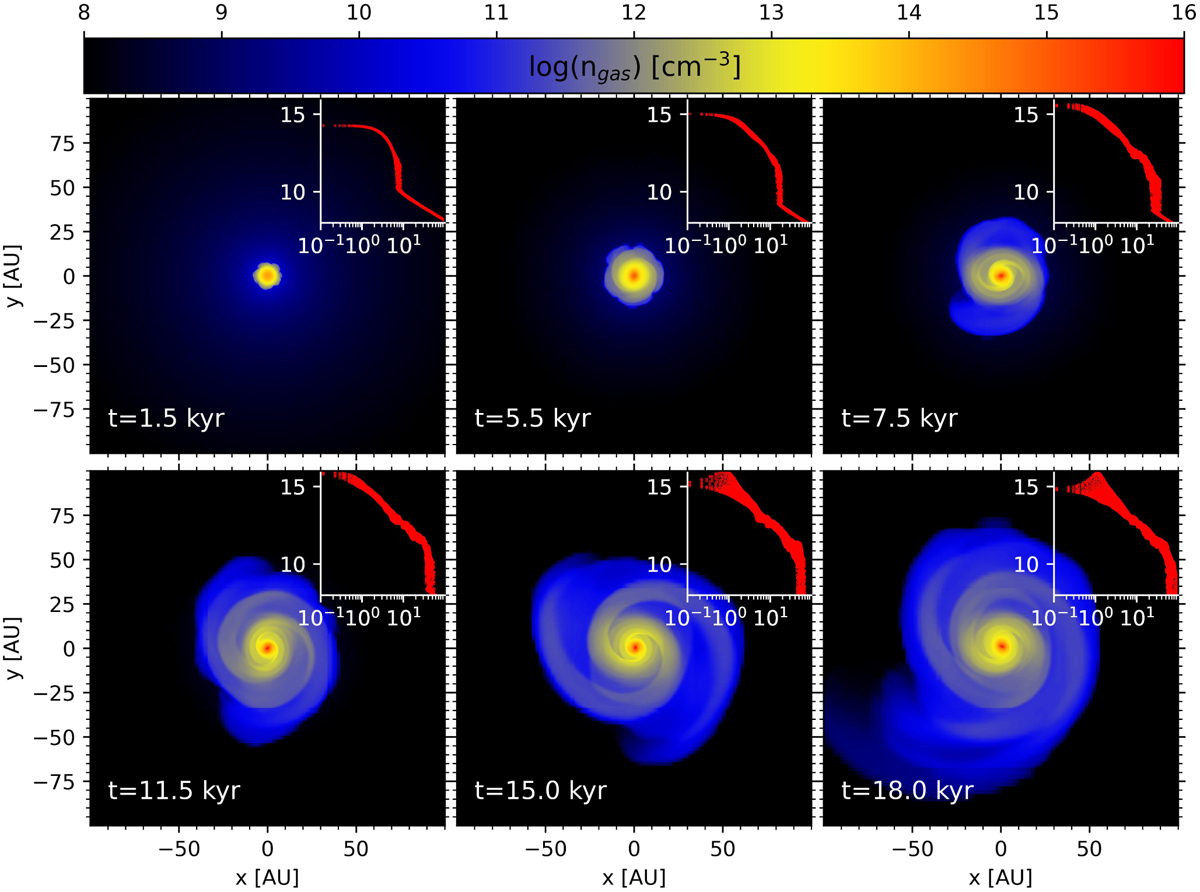
Number density for different time instances in the inner 100×100 au2 computational domain. The time is shown since the instance of disk formation. The inserts show the radial distribution of the gas number density for each time instance on the log scale.
Current usage metrics show cumulative count of Article Views (full-text article views including HTML views, PDF and ePub downloads, according to the available data) and Abstracts Views on Vision4Press platform.
Data correspond to usage on the plateform after 2015. The current usage metrics is available 48-96 hours after online publication and is updated daily on week days.
Initial download of the metrics may take a while.