Fig. 5.

Download original image
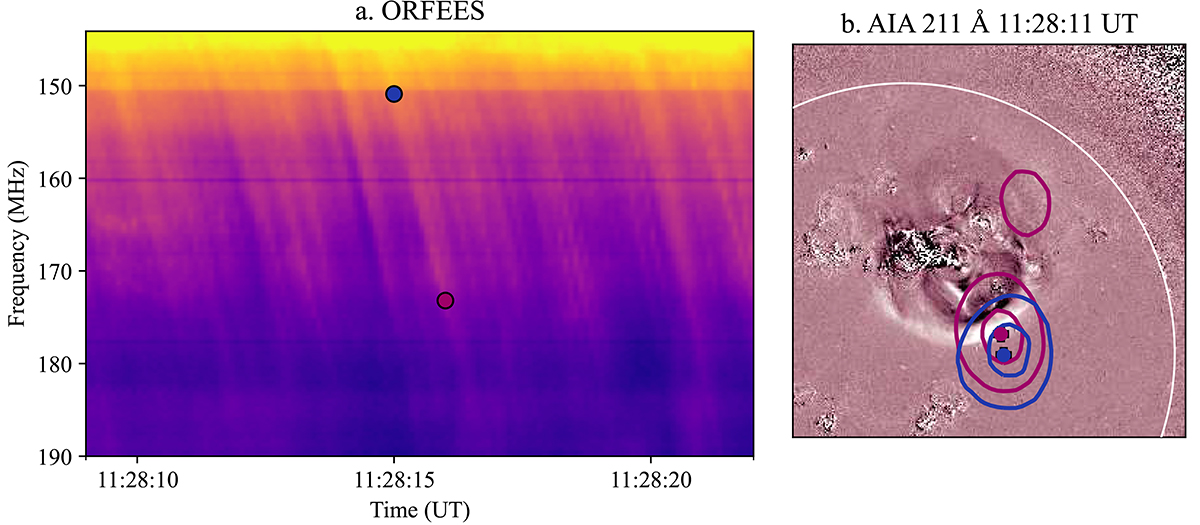
Zoom-in on the reverse drift herringbone together with their location at two frequencies. Panel a: The reverse drift herringbones are shown in a zoomed in dynamic spectrum from ORFEES and can be imaged by the NRH at 150 MHz (blue dot) and 173 MHz (magenta dot). Panel b: Radio contours at 40 and 80% of the maximum intensity level at the time and frequency denoted by the blue and magenta dots in panel a overlaid on an AIA 211 A running difference image. The centroids of these radio contours are also shown as plus symbols with the corresponding colour.
Current usage metrics show cumulative count of Article Views (full-text article views including HTML views, PDF and ePub downloads, according to the available data) and Abstracts Views on Vision4Press platform.
Data correspond to usage on the plateform after 2015. The current usage metrics is available 48-96 hours after online publication and is updated daily on week days.
Initial download of the metrics may take a while.


