Open Access
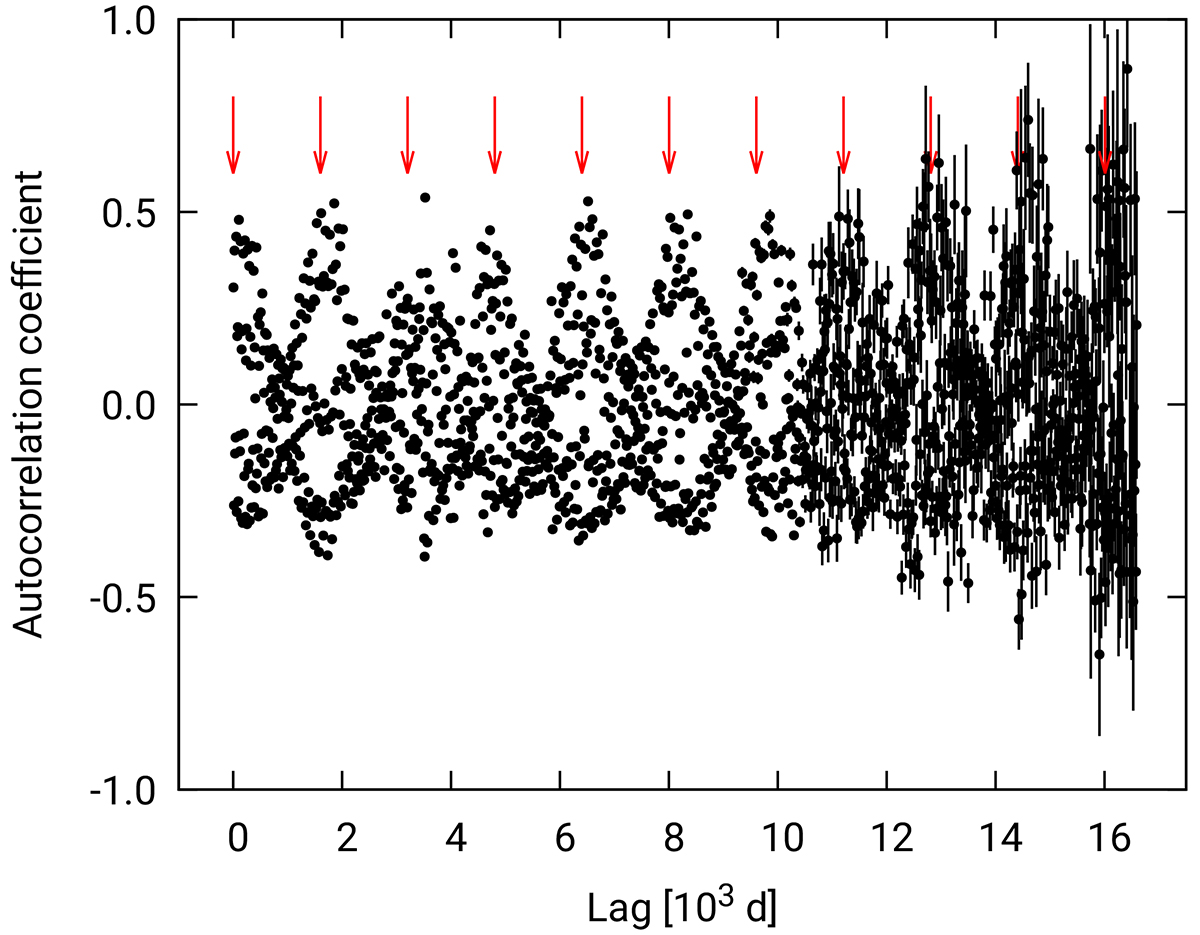
Fig. 7.
Download original image
Autocorrelation function of the entire radio light curve (shown in Fig. 2). The autocorrelation coefficient is plotted against the lag. Distinct peaks occur at integer multiples of the long-term period, marked by the red arrows.
Current usage metrics show cumulative count of Article Views (full-text article views including HTML views, PDF and ePub downloads, according to the available data) and Abstracts Views on Vision4Press platform.
Data correspond to usage on the plateform after 2015. The current usage metrics is available 48-96 hours after online publication and is updated daily on week days.
Initial download of the metrics may take a while.