Fig. 6.
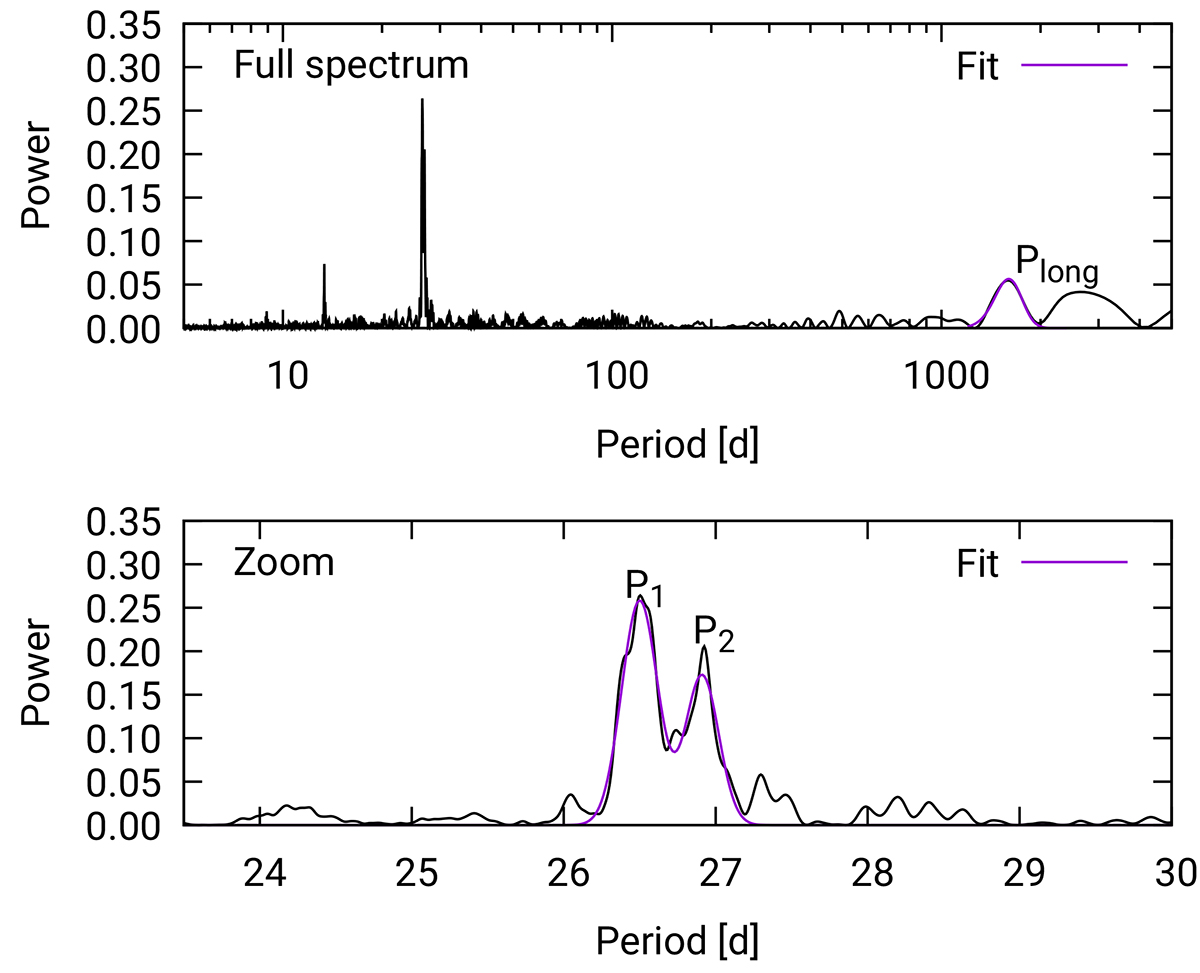
Download original image
Lomb-Scargle periodogram of the entire light curve shown in Fig. 2. The upper panel shows the entire spectrum, with a prominent feature at the position of the orbital period (and a harmonic at ∼13 d) and a feature at the position of the long-term period and a subharmonic of it. The lower panel shows a zoom into the region around the orbital period, revealing a two-peaked feature.
Current usage metrics show cumulative count of Article Views (full-text article views including HTML views, PDF and ePub downloads, according to the available data) and Abstracts Views on Vision4Press platform.
Data correspond to usage on the plateform after 2015. The current usage metrics is available 48-96 hours after online publication and is updated daily on week days.
Initial download of the metrics may take a while.