Open Access
Fig. 5.
Download original image
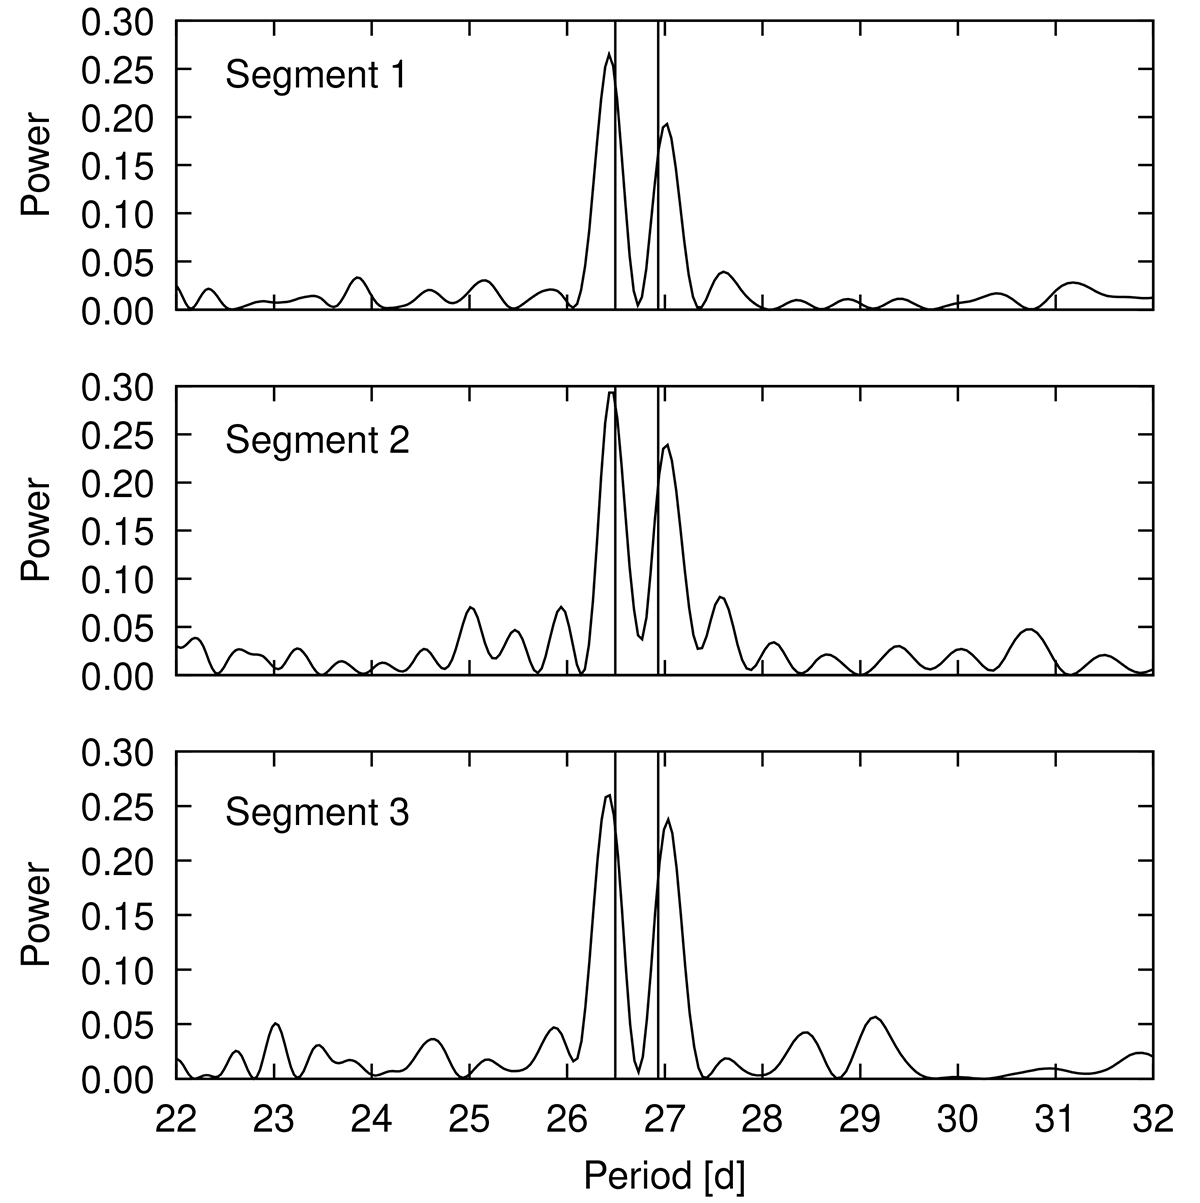
Lomb-Scargle periodograms of the OVRO data (shown in Fig. 1) divided into three individual segments. The two peaks, which are found in the full data set, are also present in each of the segments. The vertical lines indicate the positions of P1 and P2 in the full OVRO data set.
Current usage metrics show cumulative count of Article Views (full-text article views including HTML views, PDF and ePub downloads, according to the available data) and Abstracts Views on Vision4Press platform.
Data correspond to usage on the plateform after 2015. The current usage metrics is available 48-96 hours after online publication and is updated daily on week days.
Initial download of the metrics may take a while.