Open Access
Fig. 4.
Download original image
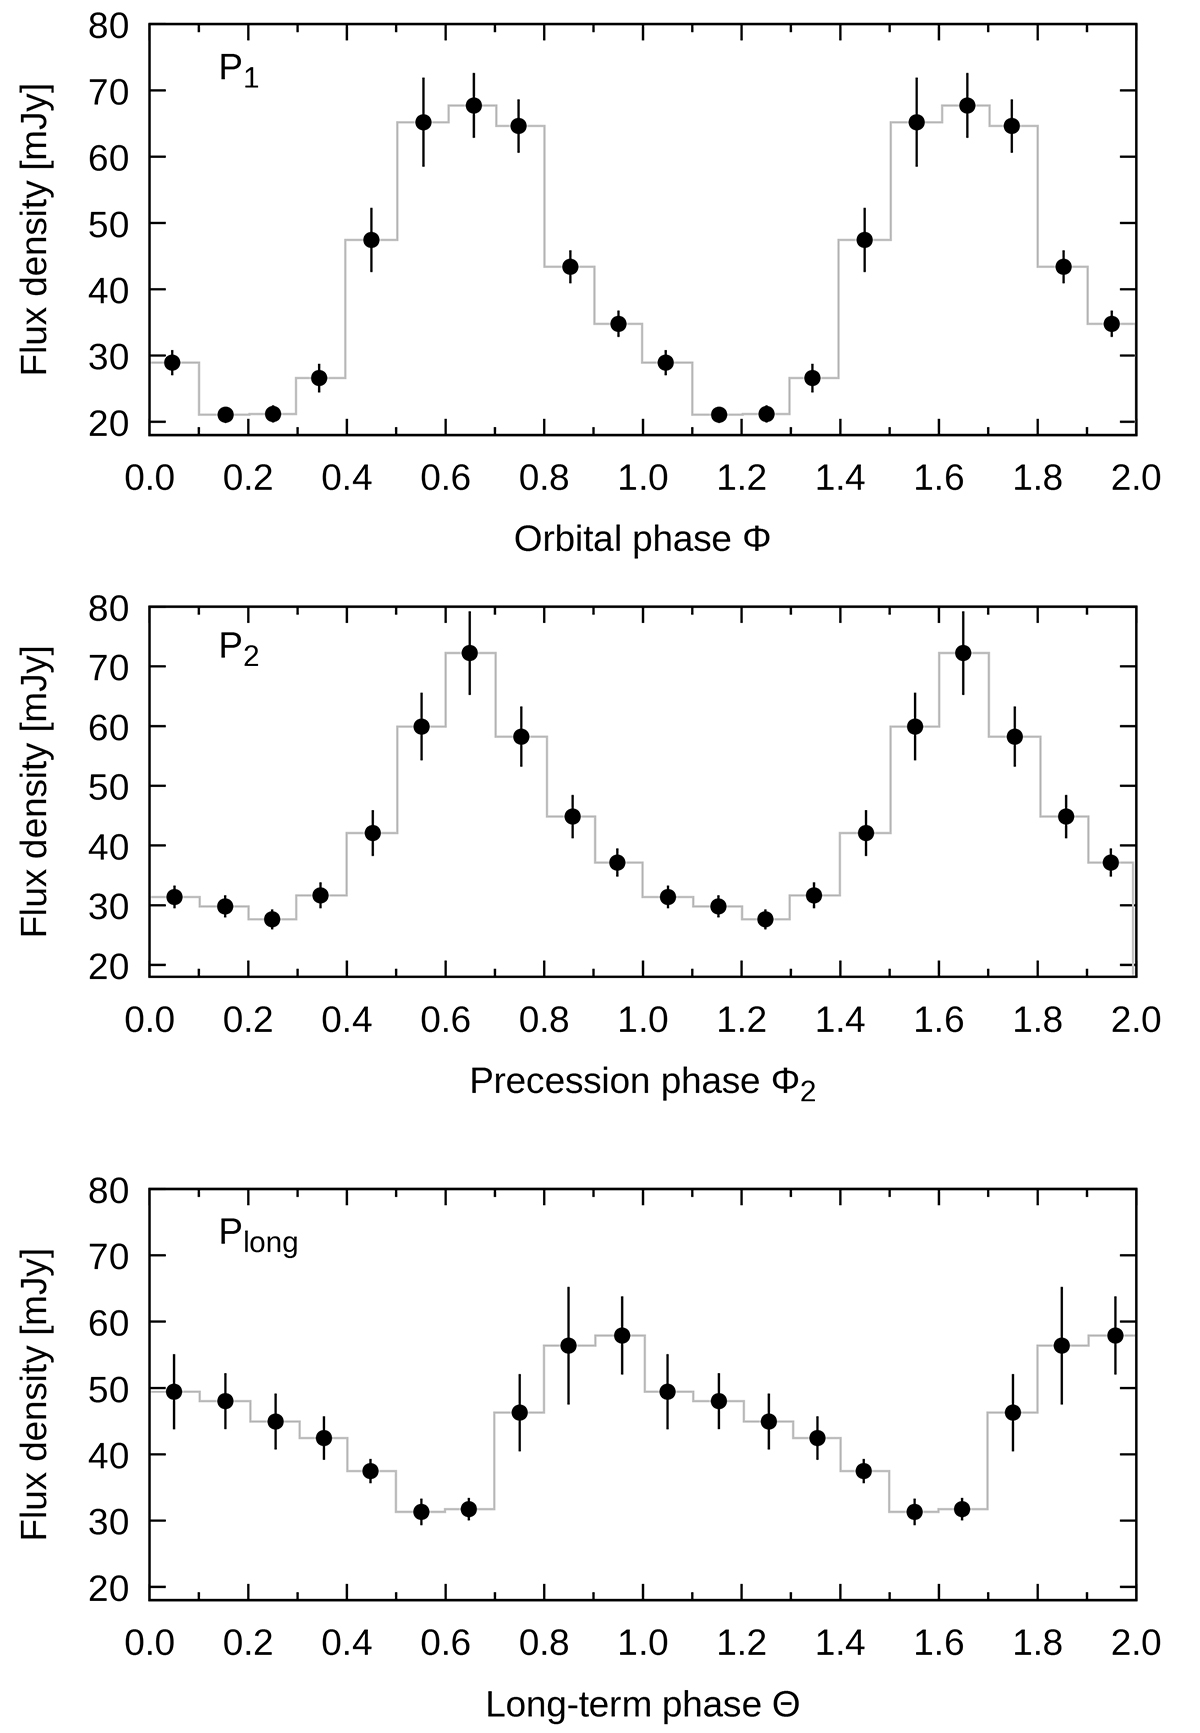
Variability profiles of the periodic signals in the OVRO data (shown in Fig. 1). Top: data folded over P1, showing the orbital profile. Middle: data folded over P2, showing the precession profile. Bottom: data folded over Plong, showing the profile of the long-term modulation.
Current usage metrics show cumulative count of Article Views (full-text article views including HTML views, PDF and ePub downloads, according to the available data) and Abstracts Views on Vision4Press platform.
Data correspond to usage on the plateform after 2015. The current usage metrics is available 48-96 hours after online publication and is updated daily on week days.
Initial download of the metrics may take a while.