Open Access
Fig. B.1.
Download original image
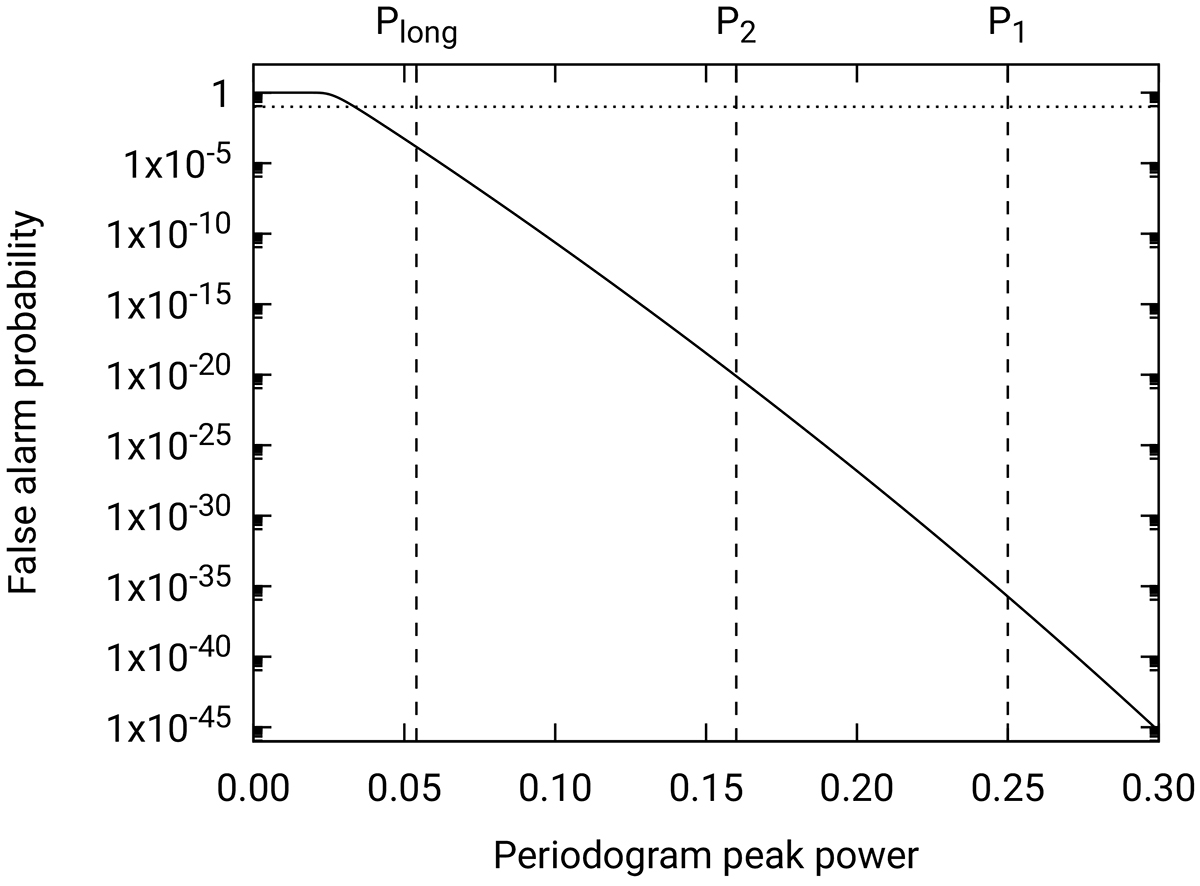
False alarm probability plotted against Lomb-Scargle peak power. The vertical dashed lines mark the peak powers of the three periods found in the periodogram. The dotted horizontal line marks a probability of p = 0.1. For the data shown here, the Baluev (2008) method has been used as implemented in astropy.
Current usage metrics show cumulative count of Article Views (full-text article views including HTML views, PDF and ePub downloads, according to the available data) and Abstracts Views on Vision4Press platform.
Data correspond to usage on the plateform after 2015. The current usage metrics is available 48-96 hours after online publication and is updated daily on week days.
Initial download of the metrics may take a while.