Open Access
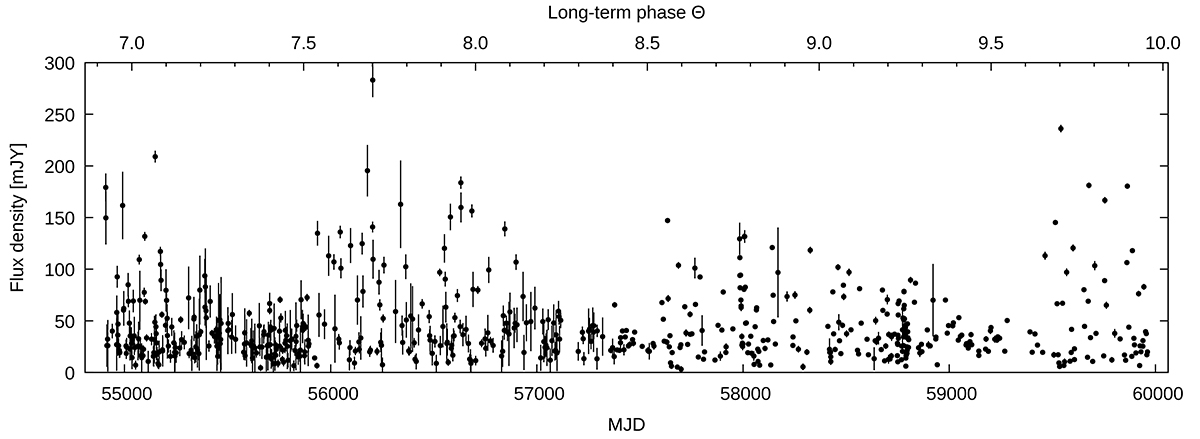
Fig. 1.
Download original image
Radio light curve from OVRO monitoring of LS I +61°303 at 15 GHz. The flux density is plotted against the time of observation given in MJD in the lower axis and in cycles of long-term modulation in the upper axis. Only data points above 1σ are plotted here and were included in the analysis for this work.
Current usage metrics show cumulative count of Article Views (full-text article views including HTML views, PDF and ePub downloads, according to the available data) and Abstracts Views on Vision4Press platform.
Data correspond to usage on the plateform after 2015. The current usage metrics is available 48-96 hours after online publication and is updated daily on week days.
Initial download of the metrics may take a while.