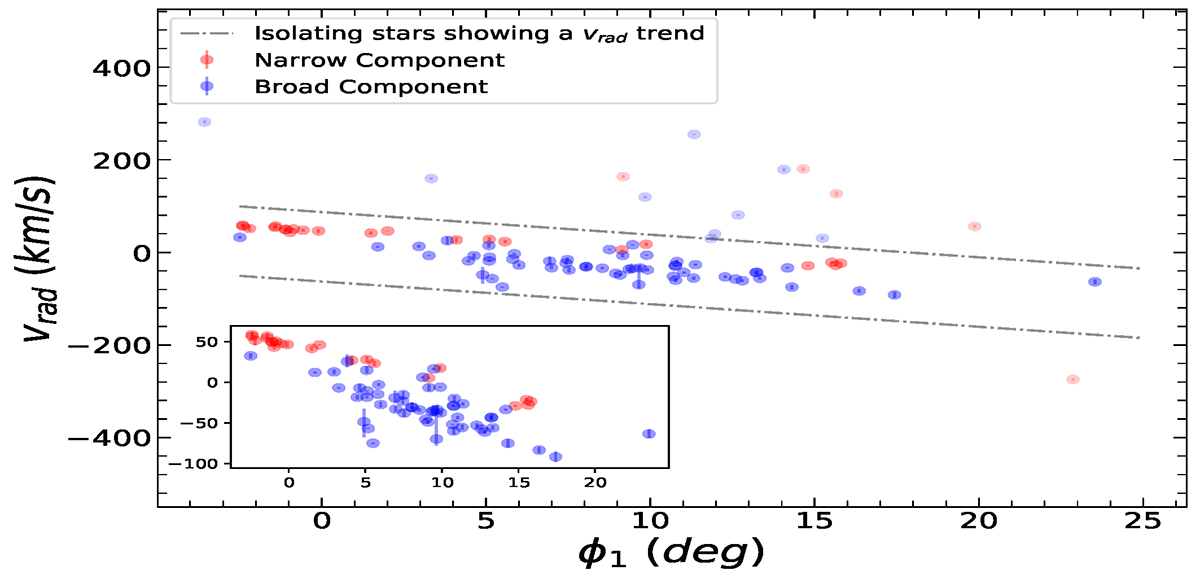
Fig. 5.
Download original image
vrad vs. ϕ1 plot for the separated stars between the narrow and broad components. The radial velocity is obtained from measurements by the S5 survey. When isolating the stars that show a trend in radial velocity i.e., those included in the dashed gray lines, we observe a separation between the two components in radial velocity. A zoom-in plot of the considered region is plotted in the bottom left corner. Stars belonging to the narrow component additionally show a narrow spread in radial velocity compared to the more dispersed broad component.
Current usage metrics show cumulative count of Article Views (full-text article views including HTML views, PDF and ePub downloads, according to the available data) and Abstracts Views on Vision4Press platform.
Data correspond to usage on the plateform after 2015. The current usage metrics is available 48-96 hours after online publication and is updated daily on week days.
Initial download of the metrics may take a while.