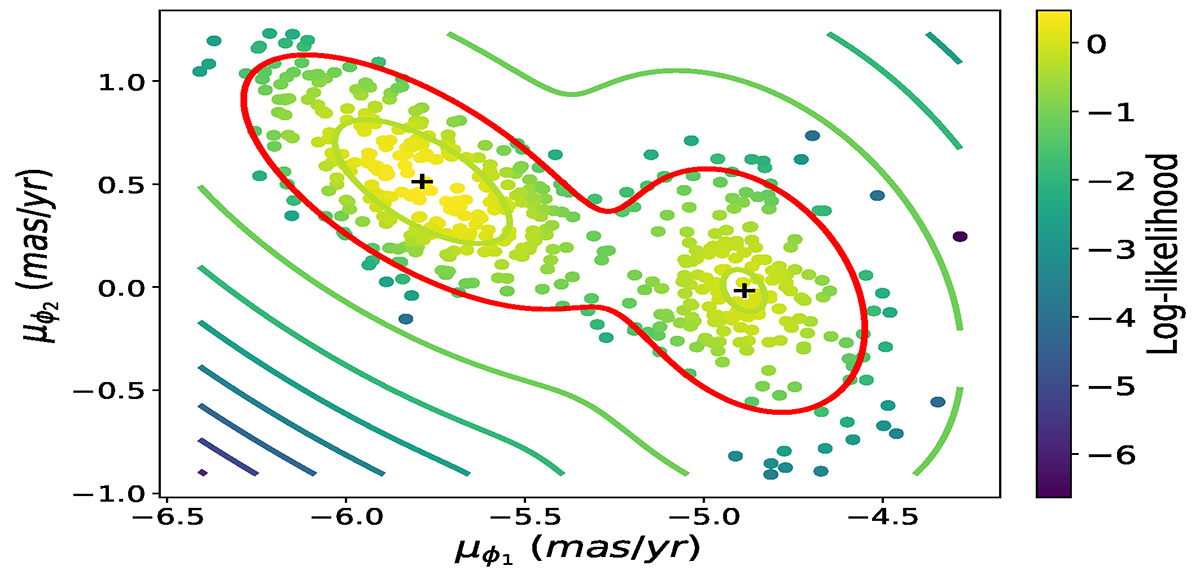
Fig. 3.
Download original image
Proper motion space of the stars remaining after the selection procedure of Sect. 3. The data points within this space are attributed a score to belong to a 2-component Gaussian mixture trained on the distribution of stars in proper motion space shown in the lower left corner of Fig. 2. The data points are colored by the score (log likelihood) over the star’s positions in proper motion space, and contours of the log likelihood are also visualized. The contours pin-point the location and direction of the trained Gaussian distributions. We also show the centers of the two Gaussian distributions by the plus sign. The red contour corresponds to log likelihood > − 1.75. All data points that fall within this contour are chosen and kept for any subsequent analysis.
Current usage metrics show cumulative count of Article Views (full-text article views including HTML views, PDF and ePub downloads, according to the available data) and Abstracts Views on Vision4Press platform.
Data correspond to usage on the plateform after 2015. The current usage metrics is available 48-96 hours after online publication and is updated daily on week days.
Initial download of the metrics may take a while.