Fig. 2.
Download original image
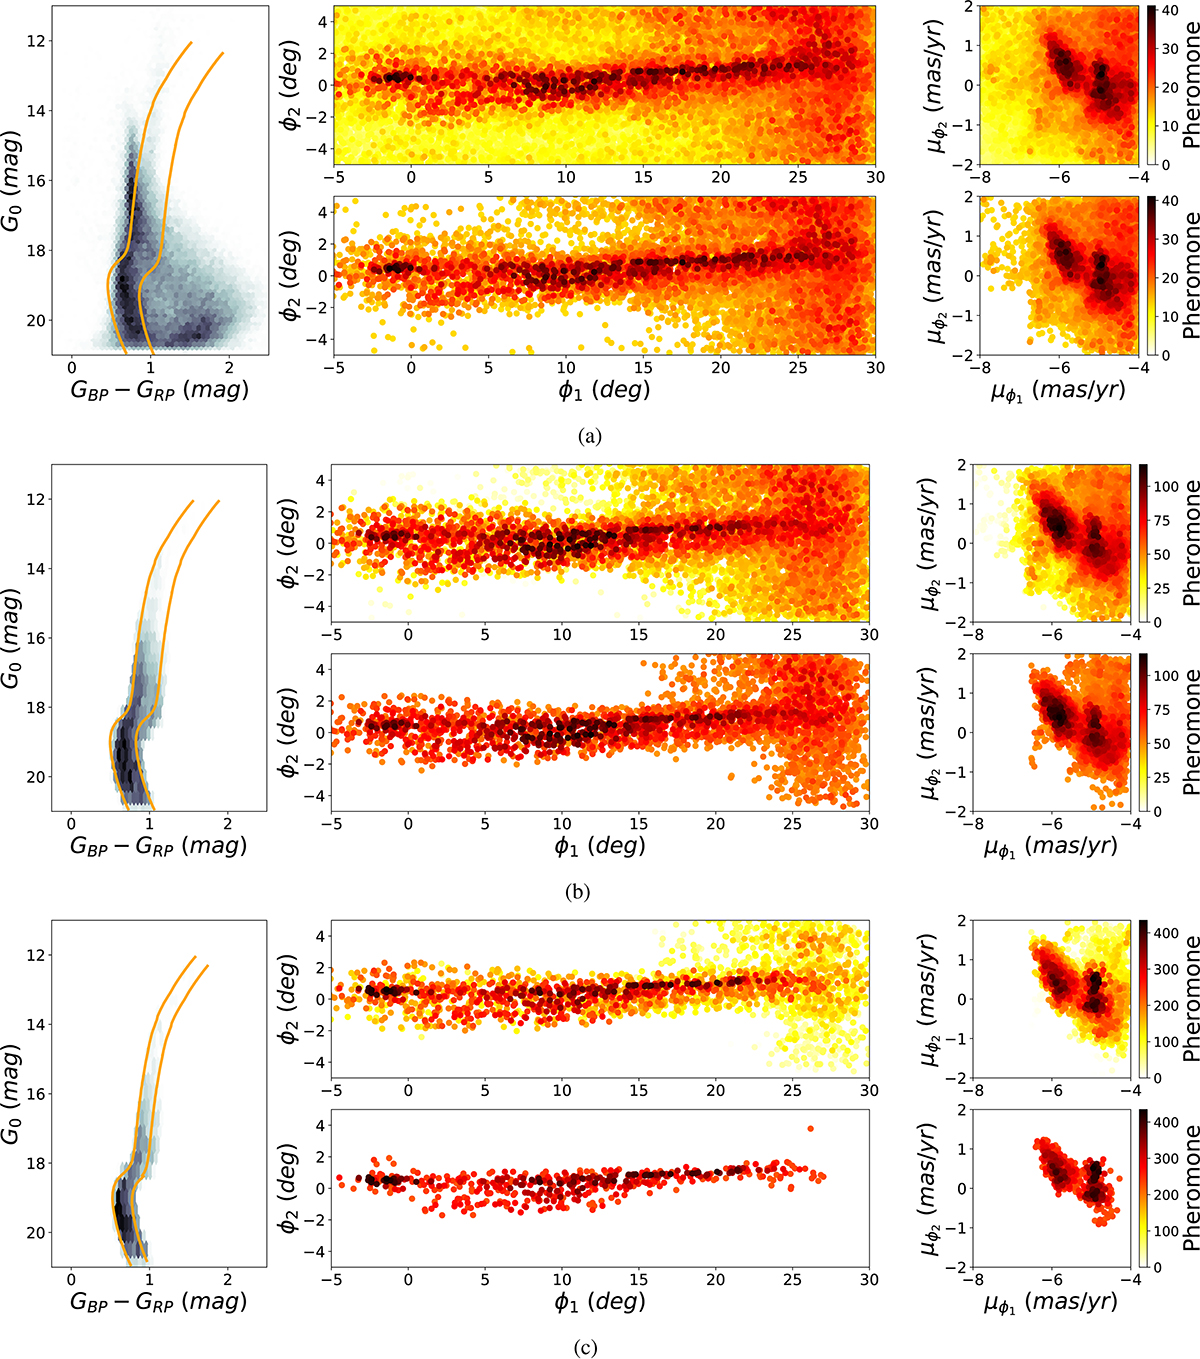
Three runs of LAAT (a–c) after fine-tuning the CMD selection between each run. The CMD refinement is shown in the first column and is applied before each LAAT iteration. Middle panels show the spatial distribution of the stars while left panels show their position in proper motion space. The upper row of the panels a–c shows the distribution of pheromone at the end of the run, while the lower row shows the remaining stars after enforcing a threshold on the pheromone quantity. Darker colors mark stars that accumulated higher quantities of pheromone, indicating regions of local alignment and density. In this way, a CMD cut is first performed, followed by finding a distribution of pheromone using LAAT and retaining stars that have accumulated a pheromone quantity that exceeds the given threshold. The CMD of the remaining stars is replotted and refined and the procedure is repeated until the stream is isolated from the majority of field stars. (a) First run of LAAT applied with a threshold of 30%. (b) Second run of LAAT applied with a threshold of 40%. (c) Third run of LAAT applied with a threshold of 50%.
Current usage metrics show cumulative count of Article Views (full-text article views including HTML views, PDF and ePub downloads, according to the available data) and Abstracts Views on Vision4Press platform.
Data correspond to usage on the plateform after 2015. The current usage metrics is available 48-96 hours after online publication and is updated daily on week days.
Initial download of the metrics may take a while.