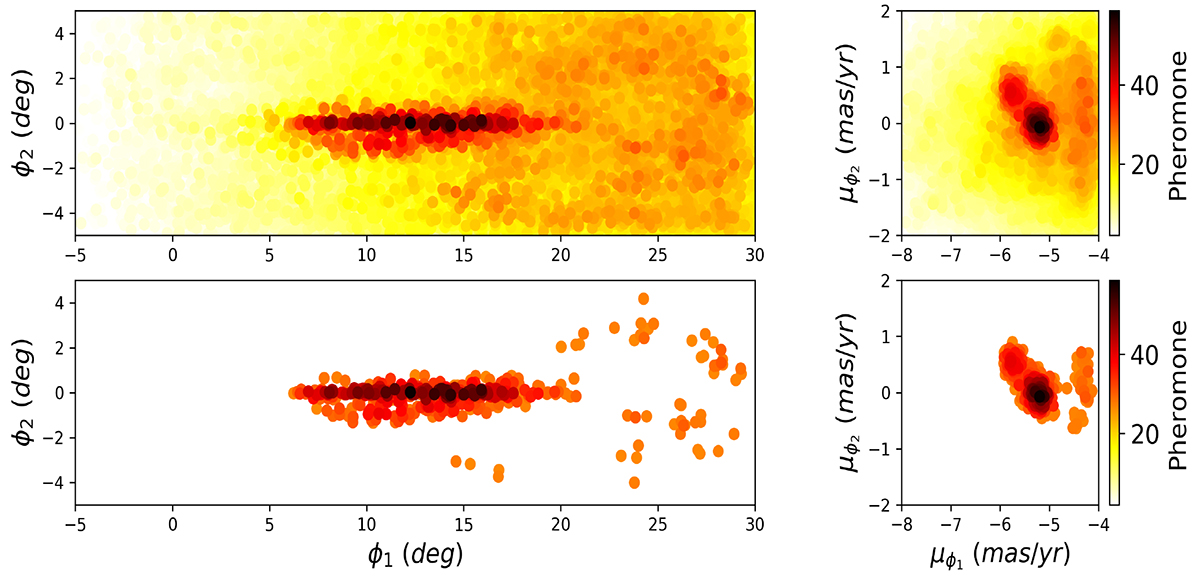
Fig. B.2.
Download original image
Similar to Figure 2 in the paper, we plotted the result of LAAT on the four-dimensional space (upper panels), and the result considering a threshold of 45% of the maximum value of pheromone during that run (lower panel). Since we know the label of each star, evaluating this result gives us an idea of the level of completeness and contamination in our sample.
Current usage metrics show cumulative count of Article Views (full-text article views including HTML views, PDF and ePub downloads, according to the available data) and Abstracts Views on Vision4Press platform.
Data correspond to usage on the plateform after 2015. The current usage metrics is available 48-96 hours after online publication and is updated daily on week days.
Initial download of the metrics may take a while.