Fig. B.1.
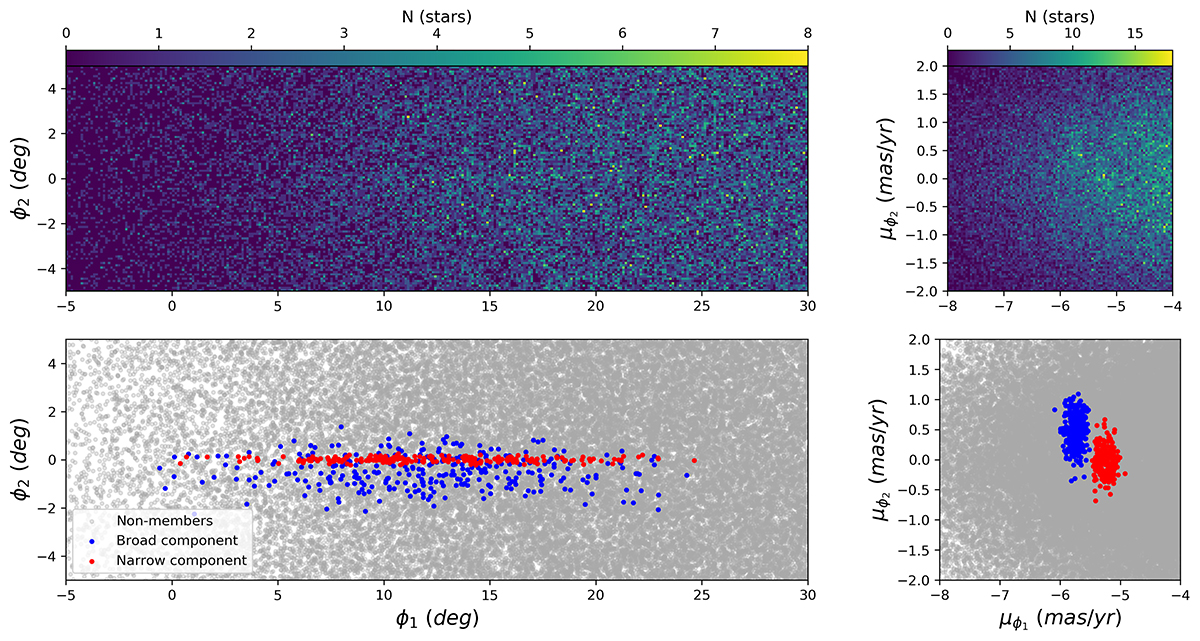
Download original image
Resulting mock dataset of the Jhelum stream along with a distribution of surrounding field stars. The left panels correspond to the distribution of the sampled stars in position space and the right panels show the location of the same sample in proper motion space. Upper panels: the colors correspond to local density where regions with lighter colors correspond to dense regions. Lower Panels: The generated data points are colored according to their known label with red for the narrow component, blue for broad component and gray for generated nonmembers.
Current usage metrics show cumulative count of Article Views (full-text article views including HTML views, PDF and ePub downloads, according to the available data) and Abstracts Views on Vision4Press platform.
Data correspond to usage on the plateform after 2015. The current usage metrics is available 48-96 hours after online publication and is updated daily on week days.
Initial download of the metrics may take a while.