Fig. 1.
Download original image
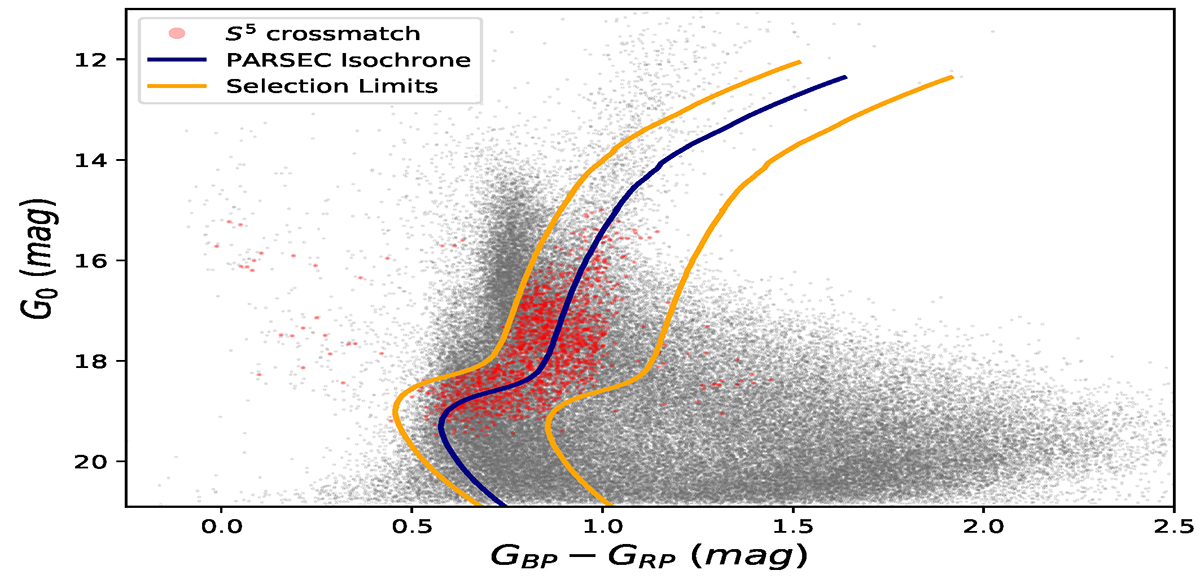
Initial color and magnitude selection. In gray we plotted the color-magnitude diagram (CMD) of the stars that follow proper motion selection and extinction correction. Red points denote common stars between the selection in gray and the stars observed by the S5 survey. Using these stars and a 12 Gyr, [Fe/H] = −1.7 PARSEC isochrone at 13 kpc (dark blue), we define the primary CMD selection as all stars lying in between the orange lines. The selection limit line on the right is positioned there to capture as many main sequence stars as possible while containing most stars in common with the S5 survey.
Current usage metrics show cumulative count of Article Views (full-text article views including HTML views, PDF and ePub downloads, according to the available data) and Abstracts Views on Vision4Press platform.
Data correspond to usage on the plateform after 2015. The current usage metrics is available 48-96 hours after online publication and is updated daily on week days.
Initial download of the metrics may take a while.