Open Access
Fig. 12.
Download original image
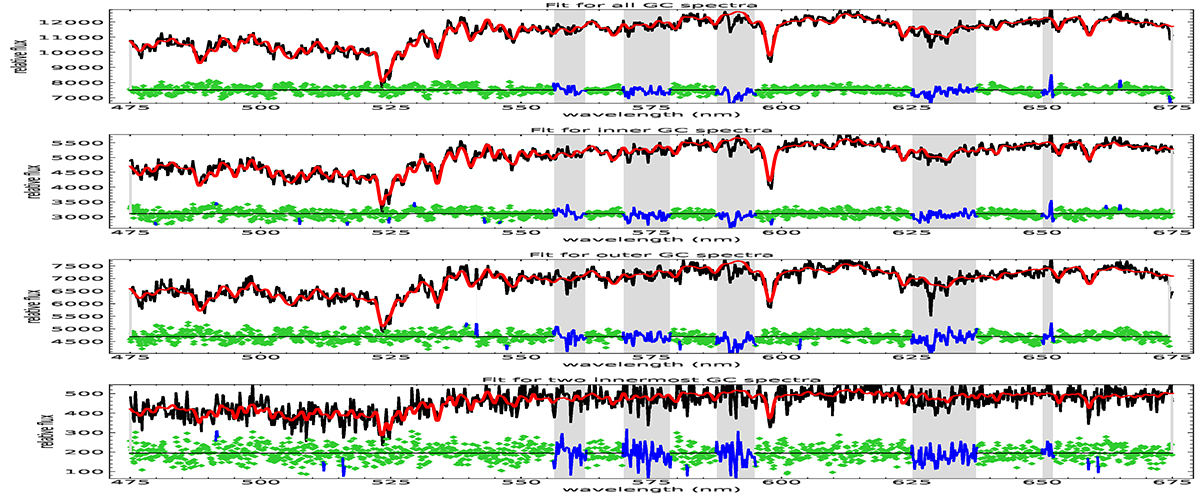
pPXF fit for stacked spectra of all (top), inner (second), outer (third), and two inner (bottom) GCs. The input spectra are shown in black, the fits in red, and the residuals in green. The gray vertical bands and blue points in the residuals indicate regions that were excluded from the fitting process.
Current usage metrics show cumulative count of Article Views (full-text article views including HTML views, PDF and ePub downloads, according to the available data) and Abstracts Views on Vision4Press platform.
Data correspond to usage on the plateform after 2015. The current usage metrics is available 48-96 hours after online publication and is updated daily on week days.
Initial download of the metrics may take a while.