Fig. 5.
Download original image
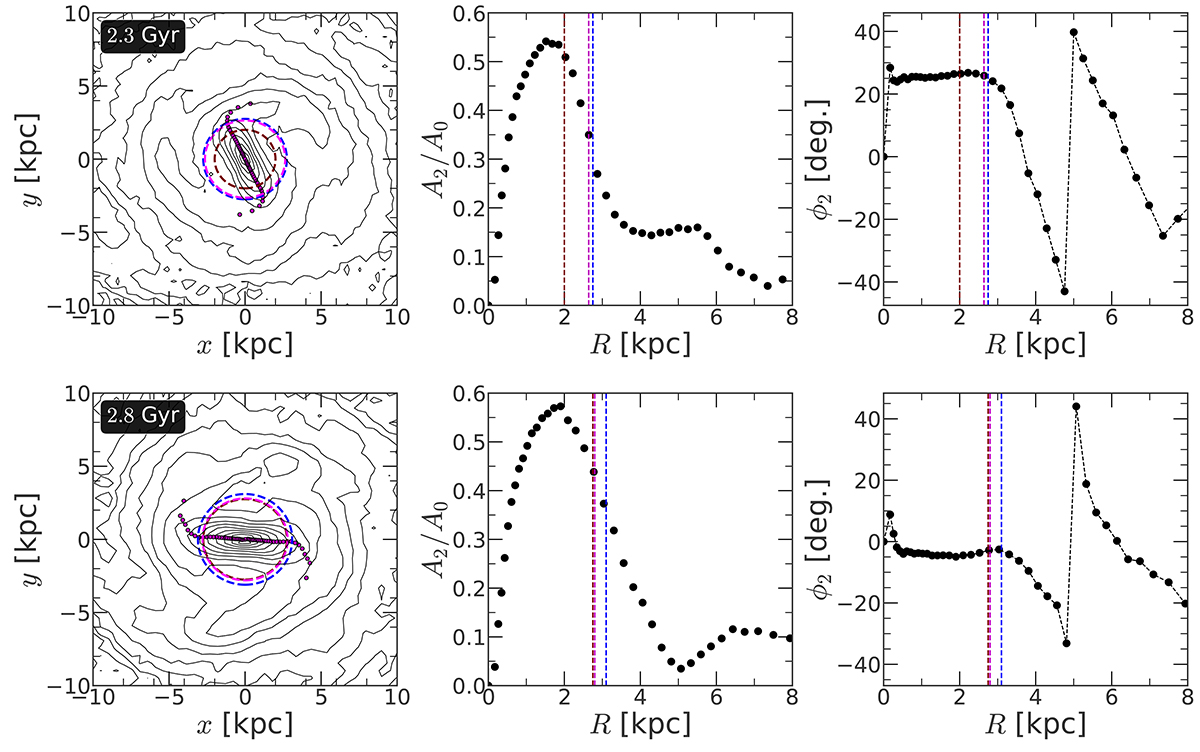
Effect of spirals in biasing the bar length. Left panels: contours of constant surface density at two different times. Magenta points denote the orientation of the phase-angle of the m = 2 Fourier moment. Dashed circles denote different bar length measurements. Middle panels: radial variation of the m = 2 Fourier coefficient (normalised by the m = 0 component). Maroon dashed line denotes the value of Rbar, 2 whereas blue dashed line denotes the value of Rbar, 3. Right panels: radial variation of the phase-angle (ϕ2) of the m = 2 Fourier moment. The magenta dashed line denotes the value of Rbar, 1. For further details, see the text. Presence of a spiral arm leads to an overestimation of bar length by ∼10 − 15% in our fiducial bar model.
Current usage metrics show cumulative count of Article Views (full-text article views including HTML views, PDF and ePub downloads, according to the available data) and Abstracts Views on Vision4Press platform.
Data correspond to usage on the plateform after 2015. The current usage metrics is available 48-96 hours after online publication and is updated daily on week days.
Initial download of the metrics may take a while.