Fig. 4.
Download original image
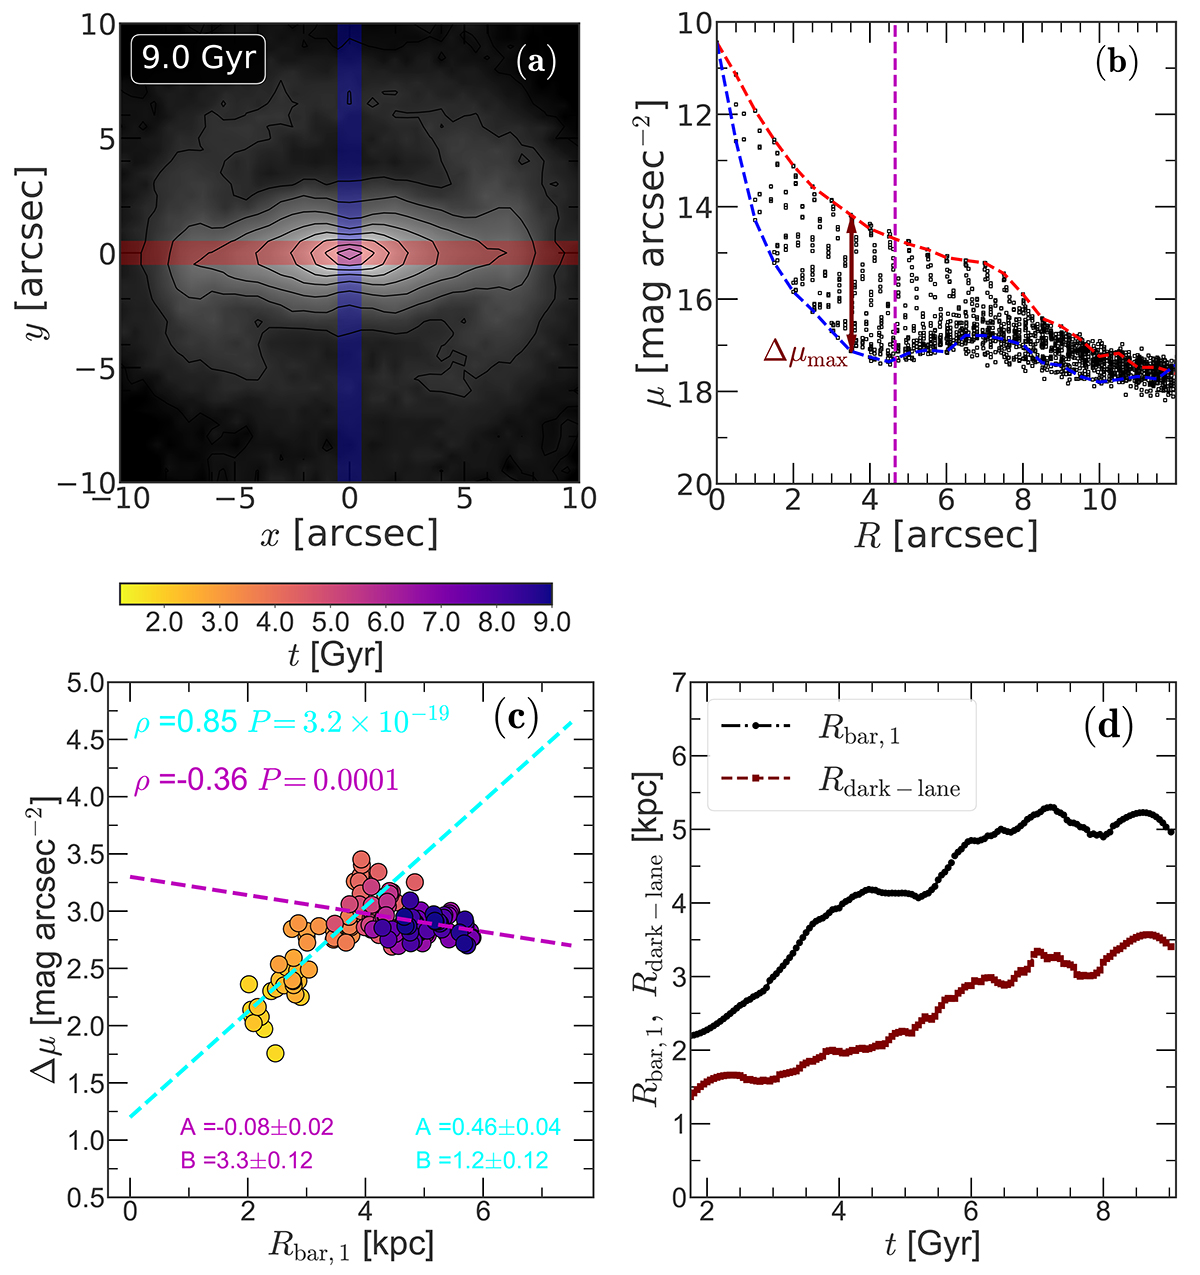
Dark-lanes as a diagnostic for bar length measurement. Panel a: face-on surface brightness distribution at t = 9 Gyr. The solid black lines denote the contours of constant surface brightness. Here, a conversion of 1 arcsec = 1 kpc and a magnitude zero-point (m0) of 22.5 mag arcsec−2 are used to create the surface brightness map from the intrinsic particle distribution. The red and blue lines denote the bar’s major and minor axis, respectively. Panel b: corresponding light profile along the bar major and minor axis (red and blue dashed lines, respectively). The radial location where the light deficit around the bar reaches its maximum is indicated by the maroon arrow. The vertical magenta line denote the bar length, Rbar, 1. A solid square represents a single pixel of the face-on surface brightness map. Panel c: distribution of the maximum light deficit around the bar with the bar length, Rbar, 1 (obtained from the constancy of the m = 2 phase-angle). A straight line of the form Y = AX + B is fitted separately (cyan and magenta dashed lines) to points, before and after t = 5 Gyr, and the corresponding best-fit values are quoted. For details, see the text. The Pearson correlations are computed, and shown in the top left corner. Panel d: temporal evolution of Rbar, 1 (bar length) and Rdark − lane for the fiducial bar model. For further details, see the text.
Current usage metrics show cumulative count of Article Views (full-text article views including HTML views, PDF and ePub downloads, according to the available data) and Abstracts Views on Vision4Press platform.
Data correspond to usage on the plateform after 2015. The current usage metrics is available 48-96 hours after online publication and is updated daily on week days.
Initial download of the metrics may take a while.