Fig. 3.
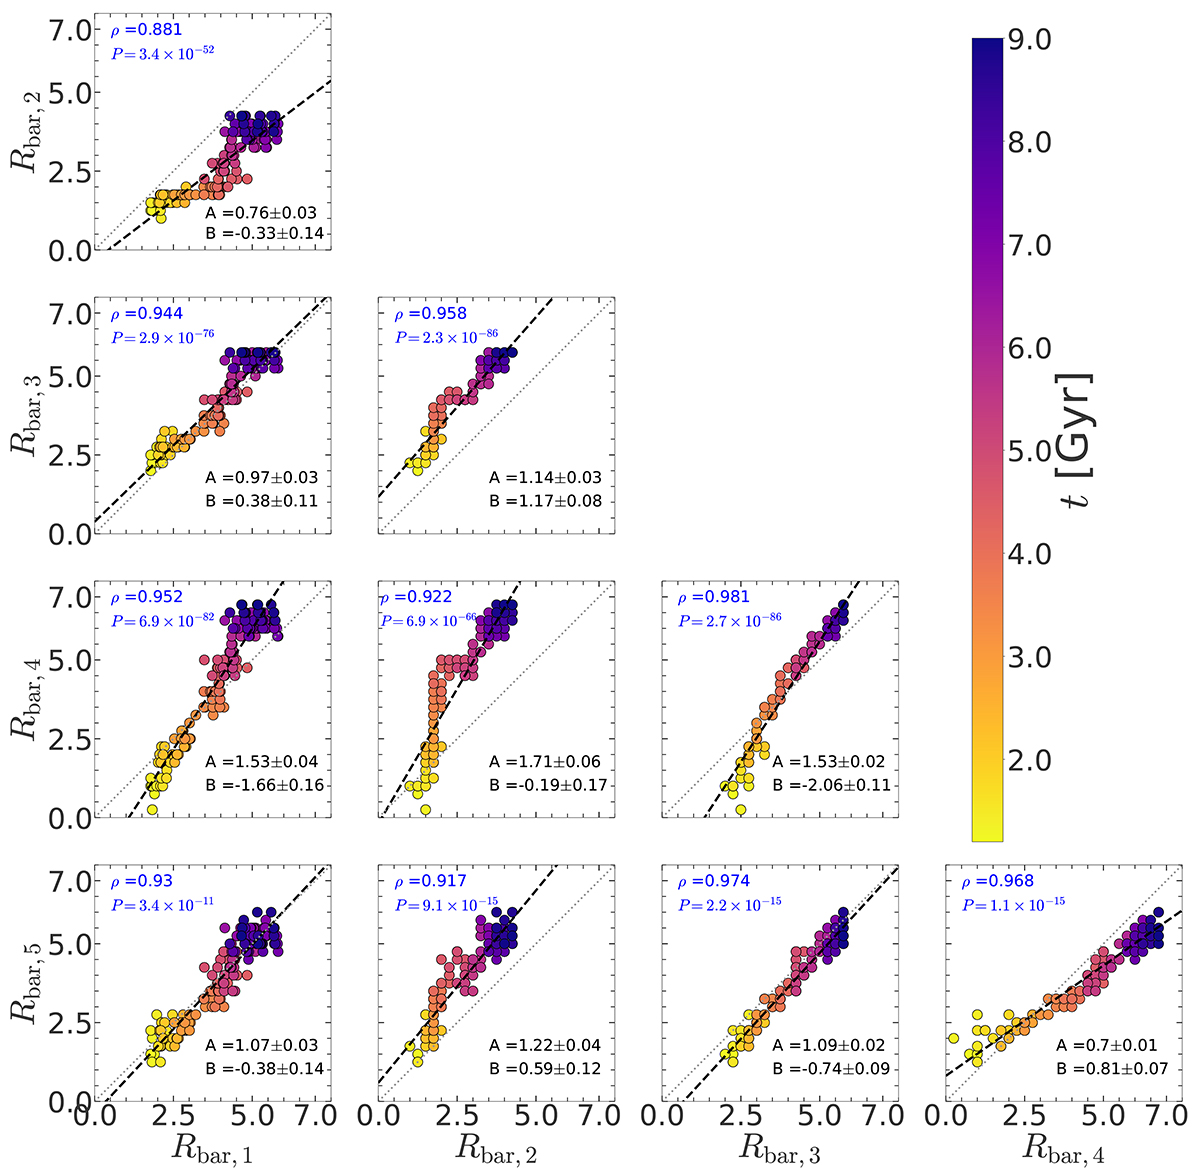
Download original image
Comparison of different methods of measuring the length of the bar, as a function of time (see the colour bar) for the fiducial bar model. For details of the bar measurement methods, see Sect. 3. In each case, a straight line of the form Y = AX + B is fitted (black dashed line) and the corresponding best-fit parameters are quoted in each sub-panel. In addition, in each case, the Pearson correlation is computed, and they are quoted in each sub-panel (see top left). The grey dotted line in each sub-panel denotes the one-to-one correspondence.
Current usage metrics show cumulative count of Article Views (full-text article views including HTML views, PDF and ePub downloads, according to the available data) and Abstracts Views on Vision4Press platform.
Data correspond to usage on the plateform after 2015. The current usage metrics is available 48-96 hours after online publication and is updated daily on week days.
Initial download of the metrics may take a while.