Fig. B.1.
Download original image
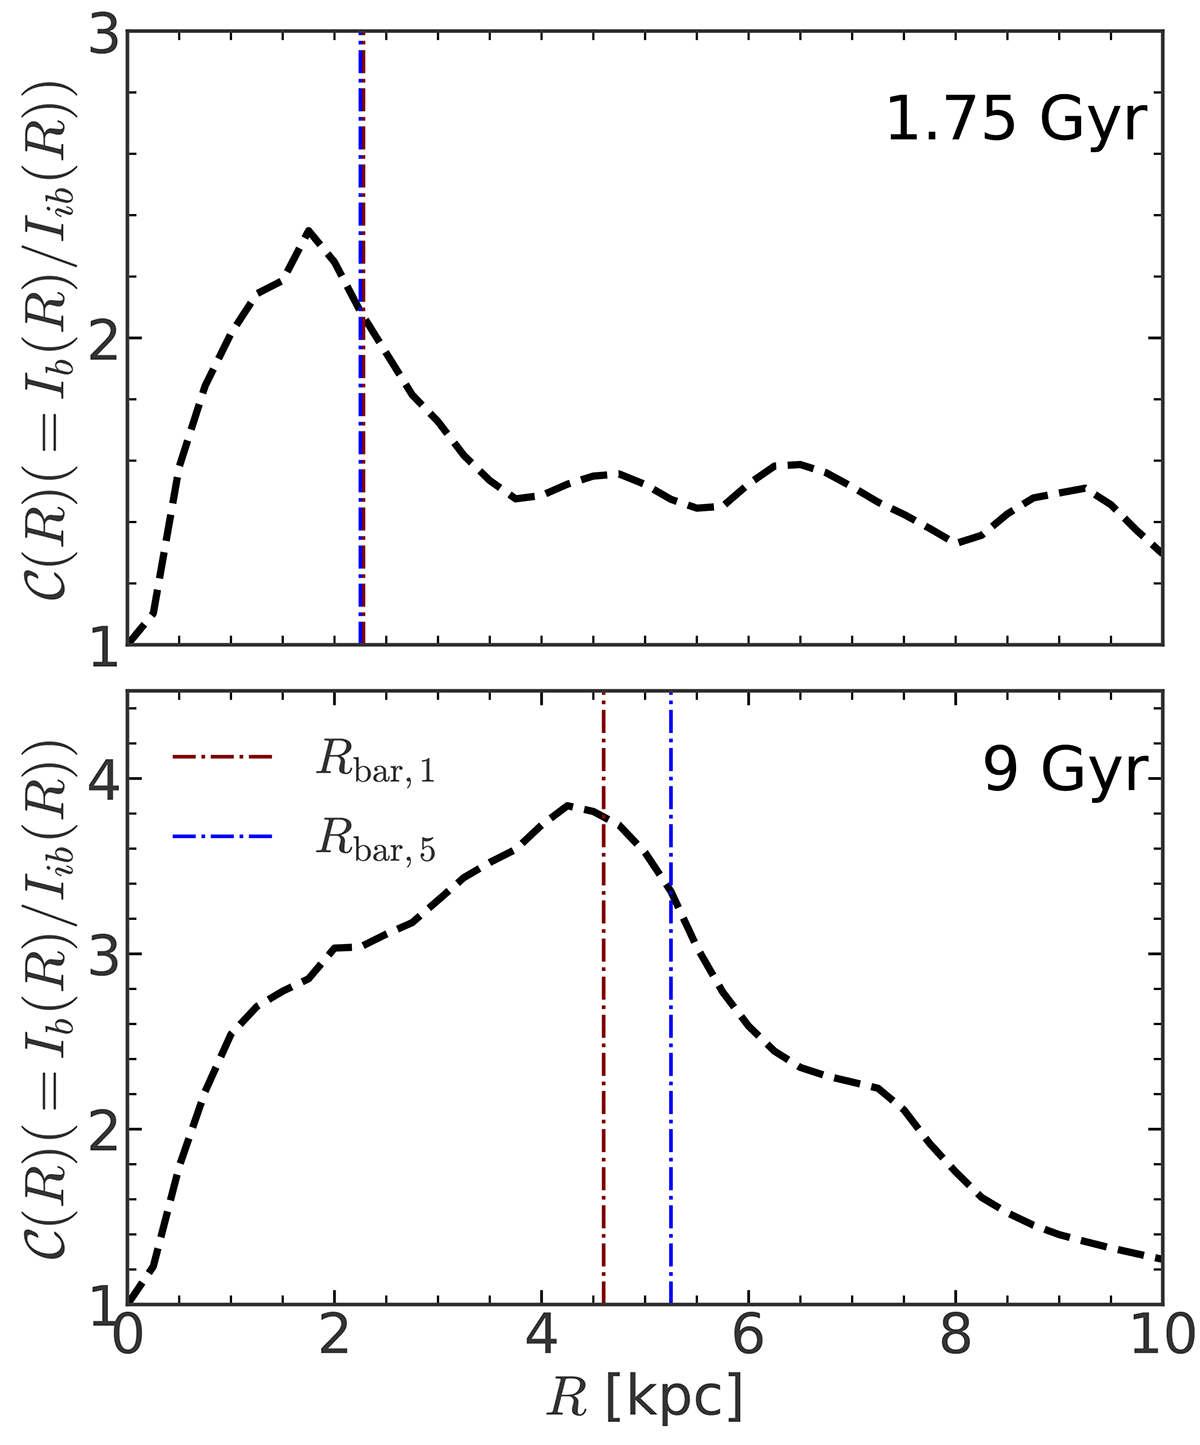
Radial variation of the contrast profile, 𝒞(R)( = Ib(R)/Iib(R)) at t = 1.75 Gyr (corresponding to an early growth phase of the bar) and t = 9 Gyr (corresponding the to end phase of the bar). The vertical maroon dashed line denotes the value of Rbar, 1, while the vertical blue dashed line denotes the value of Rbar, 5. At t = 9 Gyr, the contrast profile, 𝒞(R) shows multiple within the extent of the bar as opposed a single-peaked contrast profile at t = 1.75 Gyr.
Current usage metrics show cumulative count of Article Views (full-text article views including HTML views, PDF and ePub downloads, according to the available data) and Abstracts Views on Vision4Press platform.
Data correspond to usage on the plateform after 2015. The current usage metrics is available 48-96 hours after online publication and is updated daily on week days.
Initial download of the metrics may take a while.