Fig. 1.
Download original image
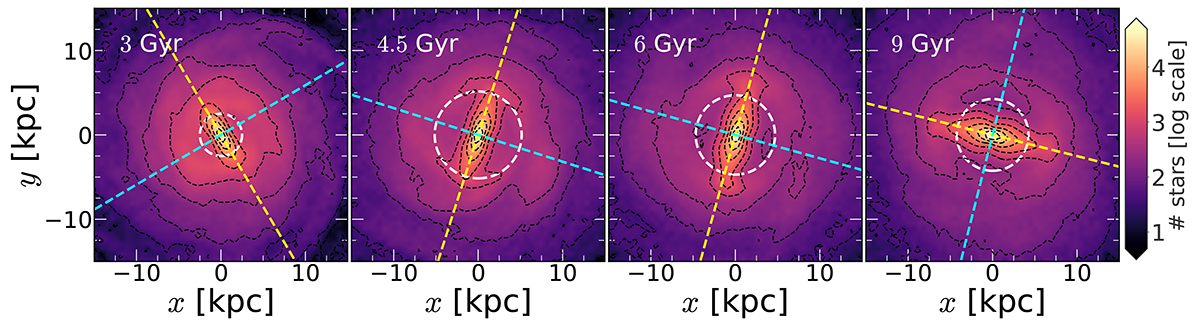
Face-on stellar density distribution at four different times, denoting different phases of the bar evolution (for details, see the text). The black dashed lines denote the contours of constant density. The yellow dashed lines denote the bar major-axis whereas the cyan dashed lines denote the bar minor-axis, respectively. The white dashed circle denotes the bar length (Rbar, 1), measured from the constancy of the phase-angle of the m = 2 Fourier moment. For details, we refer to the text.
Current usage metrics show cumulative count of Article Views (full-text article views including HTML views, PDF and ePub downloads, according to the available data) and Abstracts Views on Vision4Press platform.
Data correspond to usage on the plateform after 2015. The current usage metrics is available 48-96 hours after online publication and is updated daily on week days.
Initial download of the metrics may take a while.