Fig. 11
Download original image
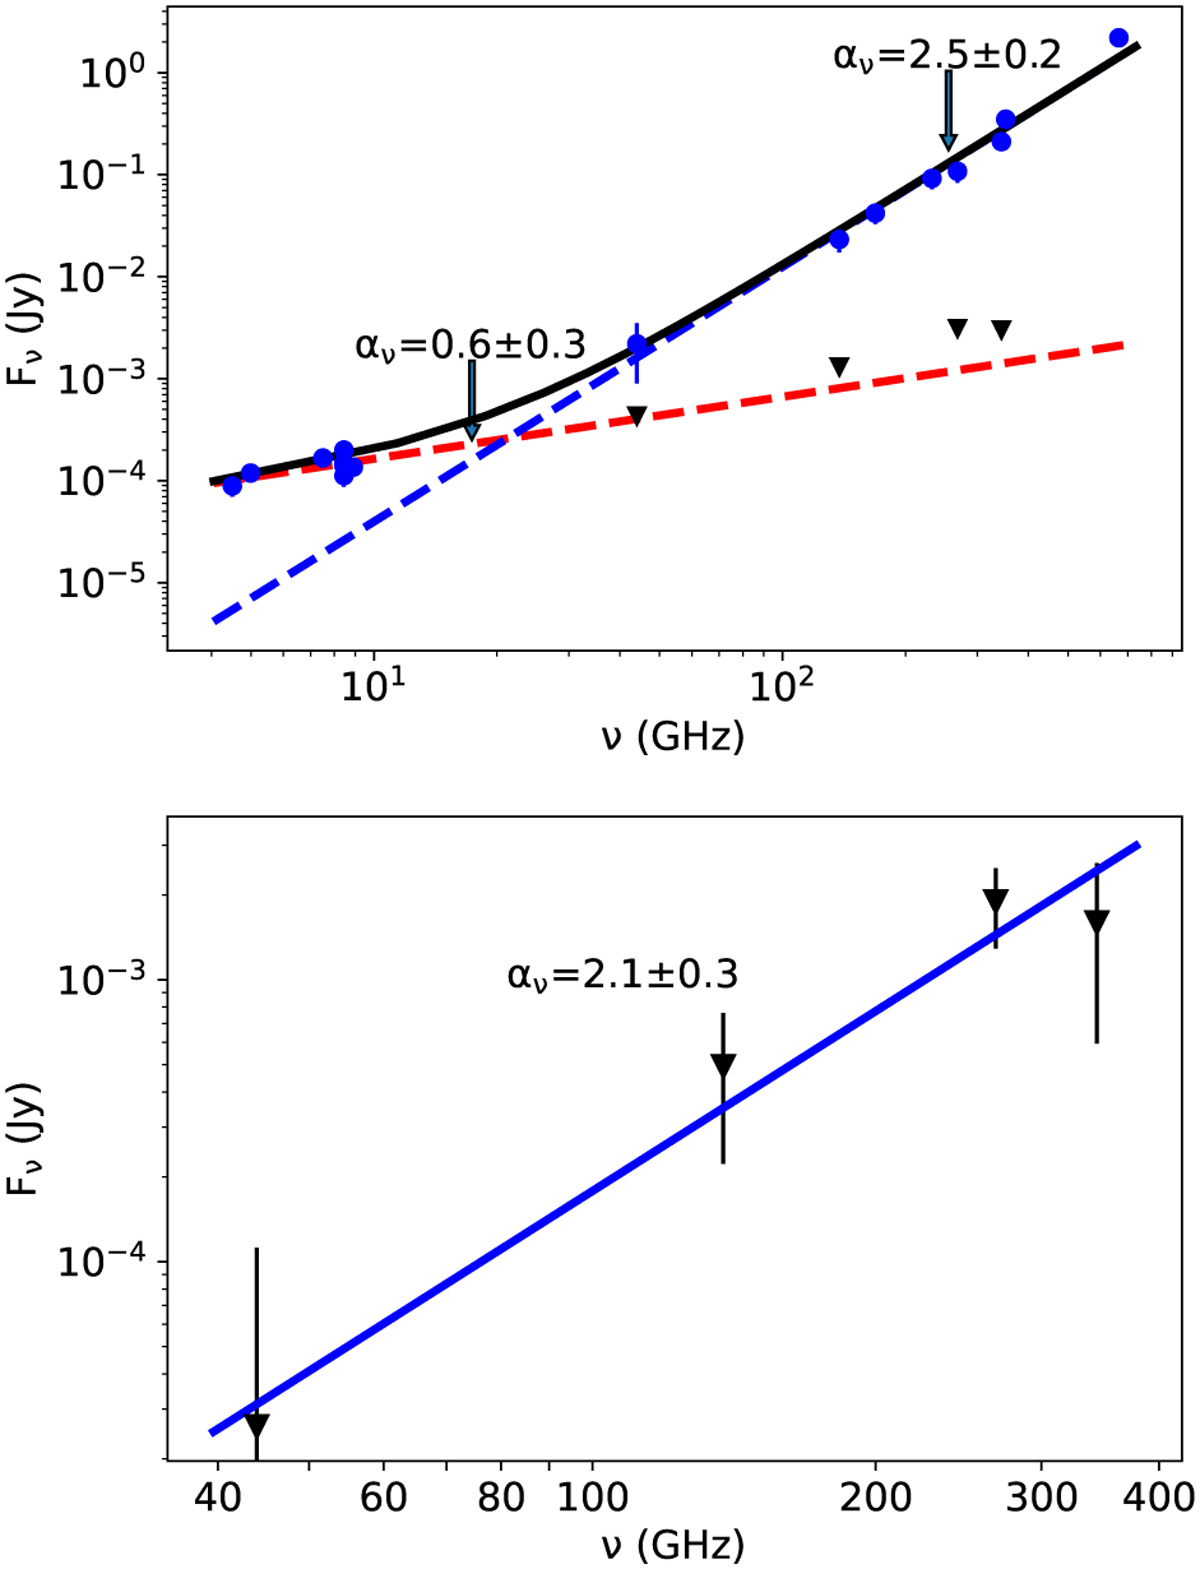
Spectral energy distribution (SED) from the sub-millimeter to centimeter wavelengths. Top: SED of the whole dist. The thick red line depicts a fit to centimeter data, while the blue one shows a fit to sub-millimeter and millimeter data. The thick black curve shows the combined fit. Blue dots are observations from this paper (millimeter data) and the literature (sub-millimeter and centimeter). Black triangles are fluxes from the central source alone. Bottom: SED of the compact source towards the center after subtracting the free-free contribution.
Current usage metrics show cumulative count of Article Views (full-text article views including HTML views, PDF and ePub downloads, according to the available data) and Abstracts Views on Vision4Press platform.
Data correspond to usage on the plateform after 2015. The current usage metrics is available 48-96 hours after online publication and is updated daily on week days.
Initial download of the metrics may take a while.