Fig. 8.
Download original image
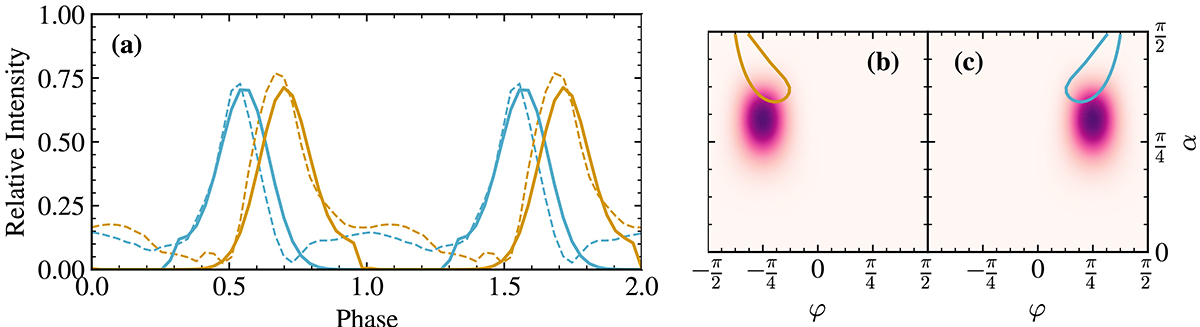
Example of toy model results. Panel a shows the single-pole pulse profiles generated with a toy model using the system parameters described in the text. The PCVA components are shown as dashed lines for reference. Panels b and c schematically show the beam patterns of the two poles. The relative intensity is colour coded between 0 (white) and 1 (dark purple). The lines indicate the parts of the beam patterns that can be seen by a distant observer and the colour correspond to the pulse profiles of panel a. The simple model allows for a displacement of the dipole configuration and the symmetry axis of the beam patterns is allowed to be offset from the normal and different for each emission region. In this example, this results in asymmetric pulse profiles that appear reflected in phase.
Current usage metrics show cumulative count of Article Views (full-text article views including HTML views, PDF and ePub downloads, according to the available data) and Abstracts Views on Vision4Press platform.
Data correspond to usage on the plateform after 2015. The current usage metrics is available 48-96 hours after online publication and is updated daily on week days.
Initial download of the metrics may take a while.