Fig. 6.
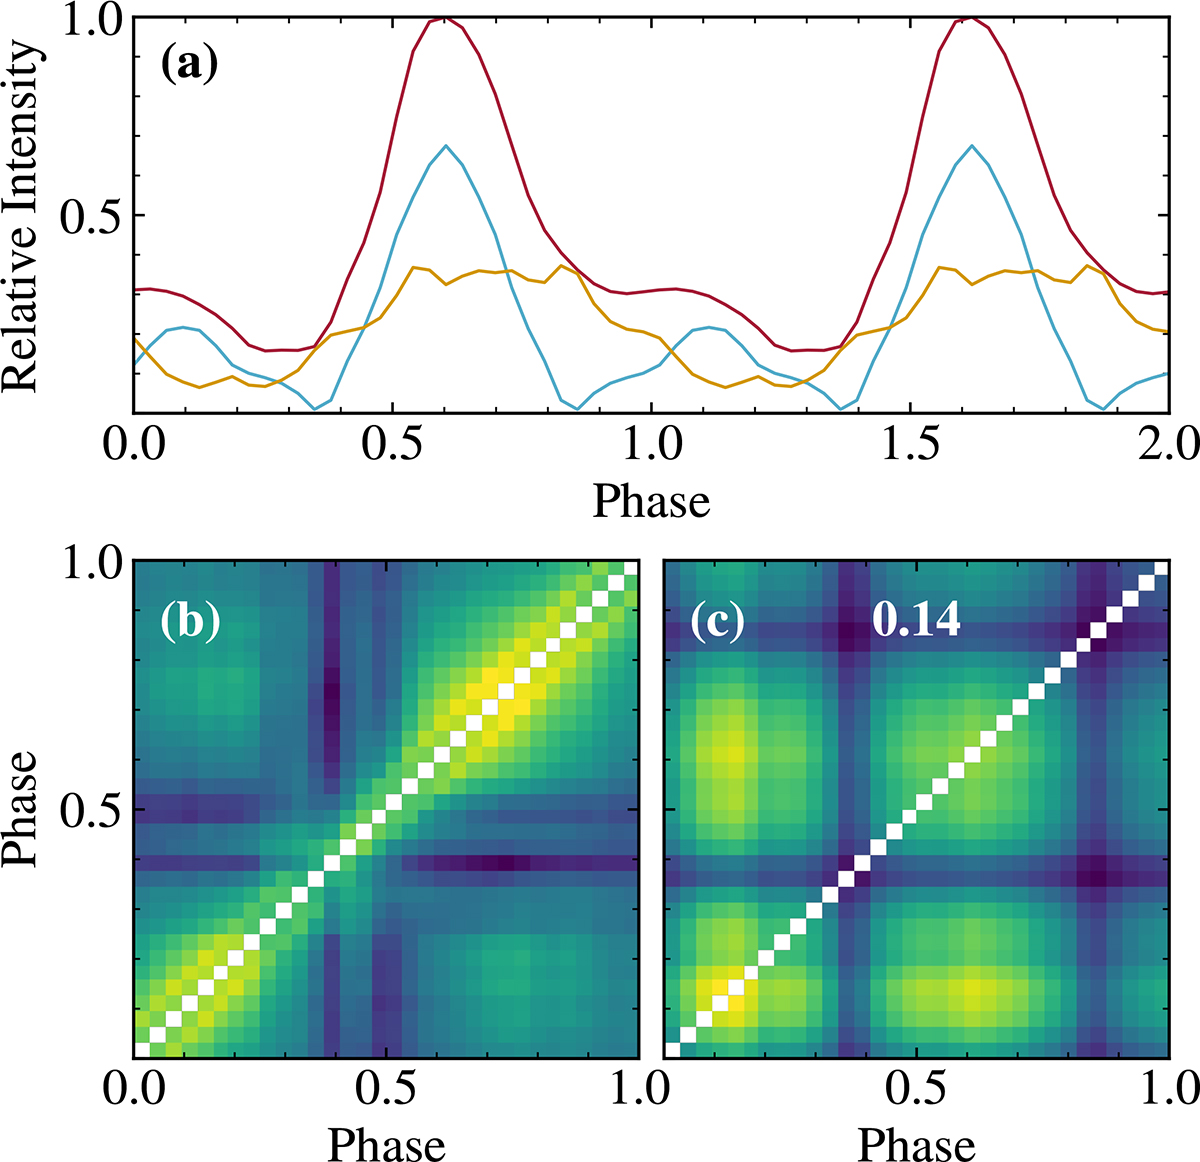
Download original image
Comparison of correlation matrices from observations and the Kraus et al. (1996) components. Panel a shows the literature decomposition of Kraus et al. (1996) in blue and yellow, together with the pulse profile of Cen X-3 in red. Panel b shows the correlation matrix of the observation and panel c shows the self-correlation matrix of the Kraus et al. (1996) components together with the Pearson correlation coefficient between panels b and c. Note that the patterns seen in the correlation matrix are quite different and show additional features compared to those seen in the actual data in panel b. The colour scale is set individually for each panel between its minimum and maximum values to highlight the patterns.
Current usage metrics show cumulative count of Article Views (full-text article views including HTML views, PDF and ePub downloads, according to the available data) and Abstracts Views on Vision4Press platform.
Data correspond to usage on the plateform after 2015. The current usage metrics is available 48-96 hours after online publication and is updated daily on week days.
Initial download of the metrics may take a while.