Fig. 5.
Download original image
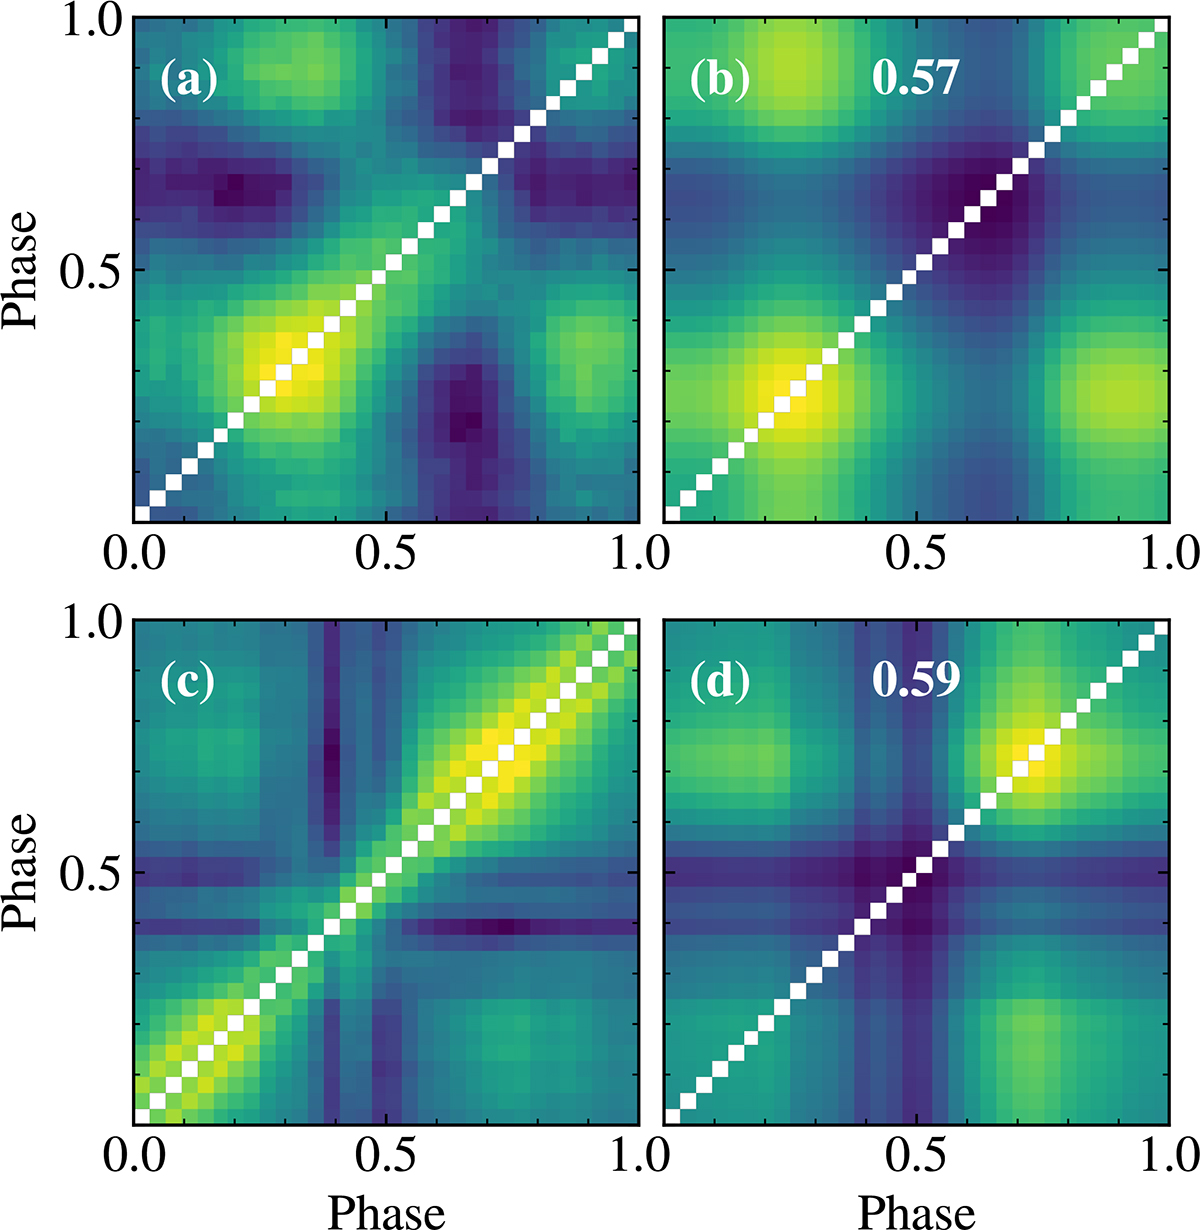
Comparison of correlation matrices derived from simulated and observed data. Panel a shows the correlation matrix of a simulation, while panel b shows the self-correlation matrix of the recovered components of PCVA for this simulation. The number in the panel indicates the Pearson correlation coefficient between panels a and b. Similarly, panel c shows the correlation matrix of the observation and panel d shows the self-correlation matrix of the PCVA components together with the Pearson correlation coefficient between the two panels. Both simulated and observed data appear to recover the components similarly well. The colour scale is set individually for each panel between its minimum and maximum values to highlight the patterns. We note that panels a and c correspond to panels b in Figs. 2 and 3 respectively, while panels b and d differ from panels d in Figs. 2 and 3 and show the self-correlation matrix instead.
Current usage metrics show cumulative count of Article Views (full-text article views including HTML views, PDF and ePub downloads, according to the available data) and Abstracts Views on Vision4Press platform.
Data correspond to usage on the plateform after 2015. The current usage metrics is available 48-96 hours after online publication and is updated daily on week days.
Initial download of the metrics may take a while.