Fig. 4.
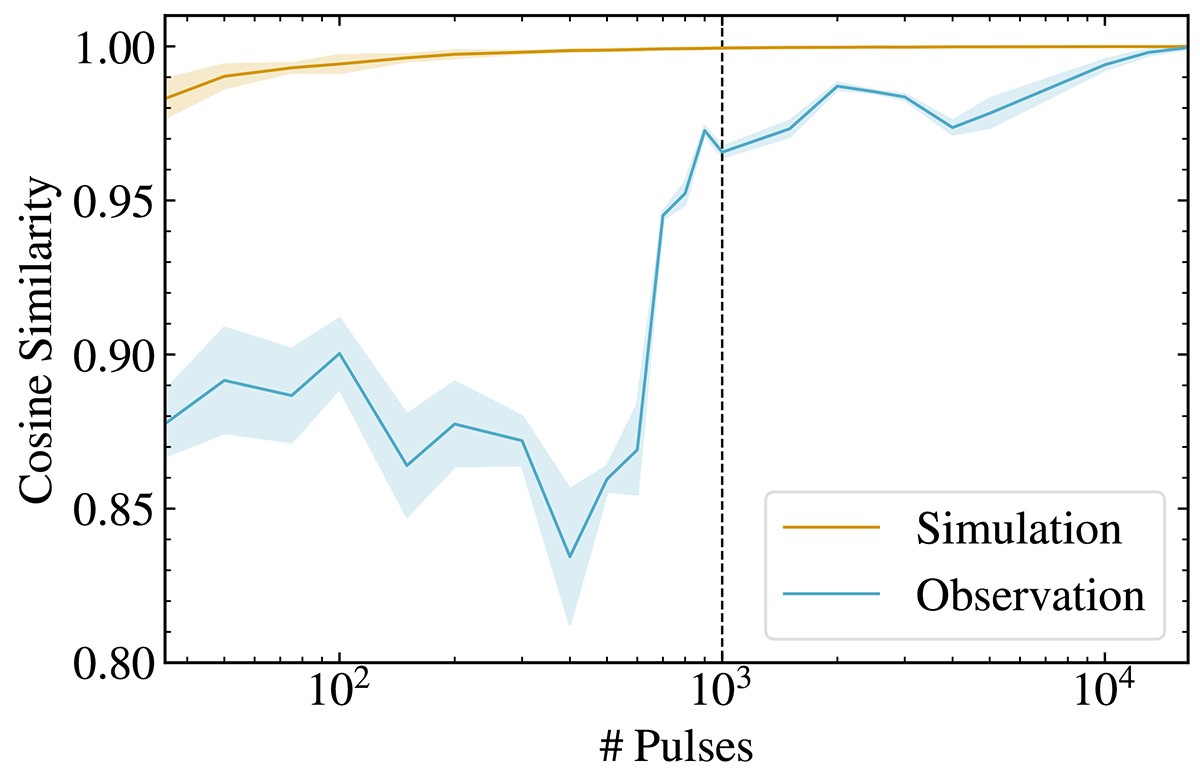
Download original image
Minimum requirements for datasets suitable for PCVA analysis, determined from simulations and subsets of observed light curves. The figure shows the cosine similarity for PCVA results using the full light curve and subsets of varying length (expressed in number of pulses) for real (blue) and simulated (yellow) light curves. The mean and standard deviation of 10 PCVA results for each subset length are shown. In both cases, statistical limitations imply that the robustness of the reconstruction decreases as the quality of the data decreases (more rapidly for real data), allowing the minimum number of pulses required for analysis to be determined.
Current usage metrics show cumulative count of Article Views (full-text article views including HTML views, PDF and ePub downloads, according to the available data) and Abstracts Views on Vision4Press platform.
Data correspond to usage on the plateform after 2015. The current usage metrics is available 48-96 hours after online publication and is updated daily on week days.
Initial download of the metrics may take a while.